Absolute Strengh Histogram
Stockcharts and Investopedia have literature on this indicator.
With the formula being:
StochRSI = (RSI - min(RSI, period)) / (max(RSI, period) - min(RSI, period))
In theory the period to calculate the RSI is the same that will later be
applied to find out the minimum and maximum values of the RSI. That means
that if the chosen period is 14 (de-facto standard) for the RSI, the total
look-back period for the indicator will be 28
Note
The actual look-back period will be a bit longer, because a 14-period
RSI has a longer effective look-back period of 15, as the comparison
of the closing prices of the 1st two periods is needed to kick-start the
calculations
In any case, backtrader does calculate all the needed look-back and warm-up periods automatically.
Considering that the following are built-in indicators in backtrader:
RSILowest(akaMaxN)Highest(akaMinN)
developing the StochRSI according to the formula seen above is
straightforward.
class StochRSI(bt.Indicator):
    lines = ('stochrsi',)
    params = dict(
        period=14,  # to apply to RSI
        pperiod=None,  # if passed apply to HighestN/LowestN, else "period"
    )

    def __init__(self):
        rsi = bt.ind.RSI(self.data, period=self.p.period)

        pperiod = self.p.pperiod or self.p.period
        maxrsi = bt.ind.Highest(rsi, period=pperiod)
        minrsi = bt.ind.Lowest(rsi, period=pperiod)

        self.l.stochrsi = (rsi - minrsi) / (maxrsi - minrsi)
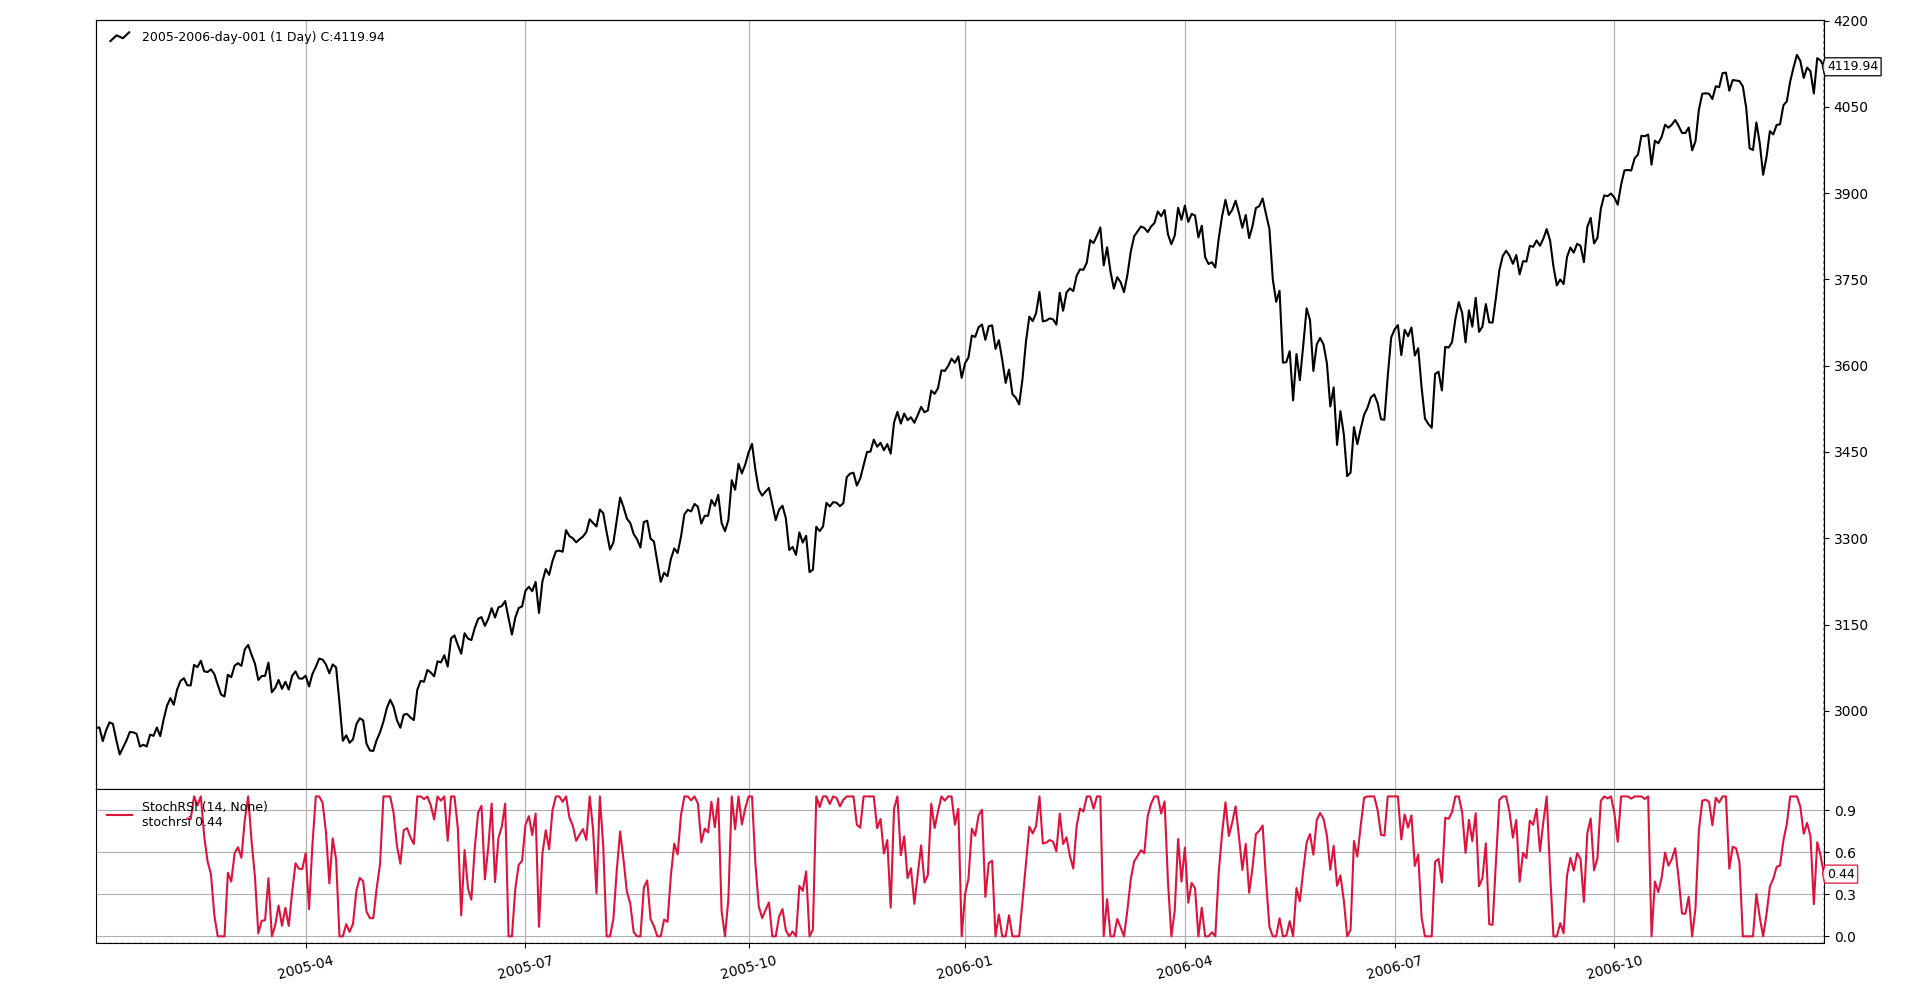
And here a view of how the indicator works