Stochastic (Generic)
backtrader already includes a Stochastic indicator (including a variant
which displays the three calculated lines and not just the usual two %k and
%d lines)
But such indicator assumes that the data source for the calculations has
high, low and close components. This is so because the original
definition uses those components.
If one wants to use different components, a first approach could be creating a
data feed which stores the different components in the high, low and
close lines of the data feed.
But a much more straightforward approach is to have a Generic Stochastic
indicator which takes three (3) data components and uses them as if they were
the high, low and close components.
The code below does that and adds a nice touch by allowing customization of the moving average for the 2nd smoothing.
class Stochastic_Generic(bt.Indicator):
    '''
    This generic indicator doesn't assume the data feed has the components
    ``high``, ``low`` and ``close``. It needs three data sources passed to it,
    which whill considered in that order. (following the OHLC standard naming)
    '''
    lines = ('k', 'd', 'dslow',)
    params = dict(
        pk=14,
        pd=3,
        pdslow=3,
        movav=bt.ind.SMA,
        slowav=None,
    )

    def __init__(self):
        # Get highest from period k from 1st data
        highest = bt.ind.Highest(self.data0, period=self.p.pk)
        # Get lowest from period k from 2nd data
        lowest = bt.ind.Lowest(self.data1, period=self.p.pk)

        # Apply the formula to get raw K
        kraw = 100.0 * (self.data2 - lowest) / (highest - lowest)

        # The standard k in the indicator is a smoothed versin of K
        self.l.k = k = self.p.movav(kraw, period=self.p.pd)

        # Smooth k => d
        slowav = self.p.slowav or self.p.movav  # chose slowav
        self.l.d = slowav(k, period=self.p.pdslow)
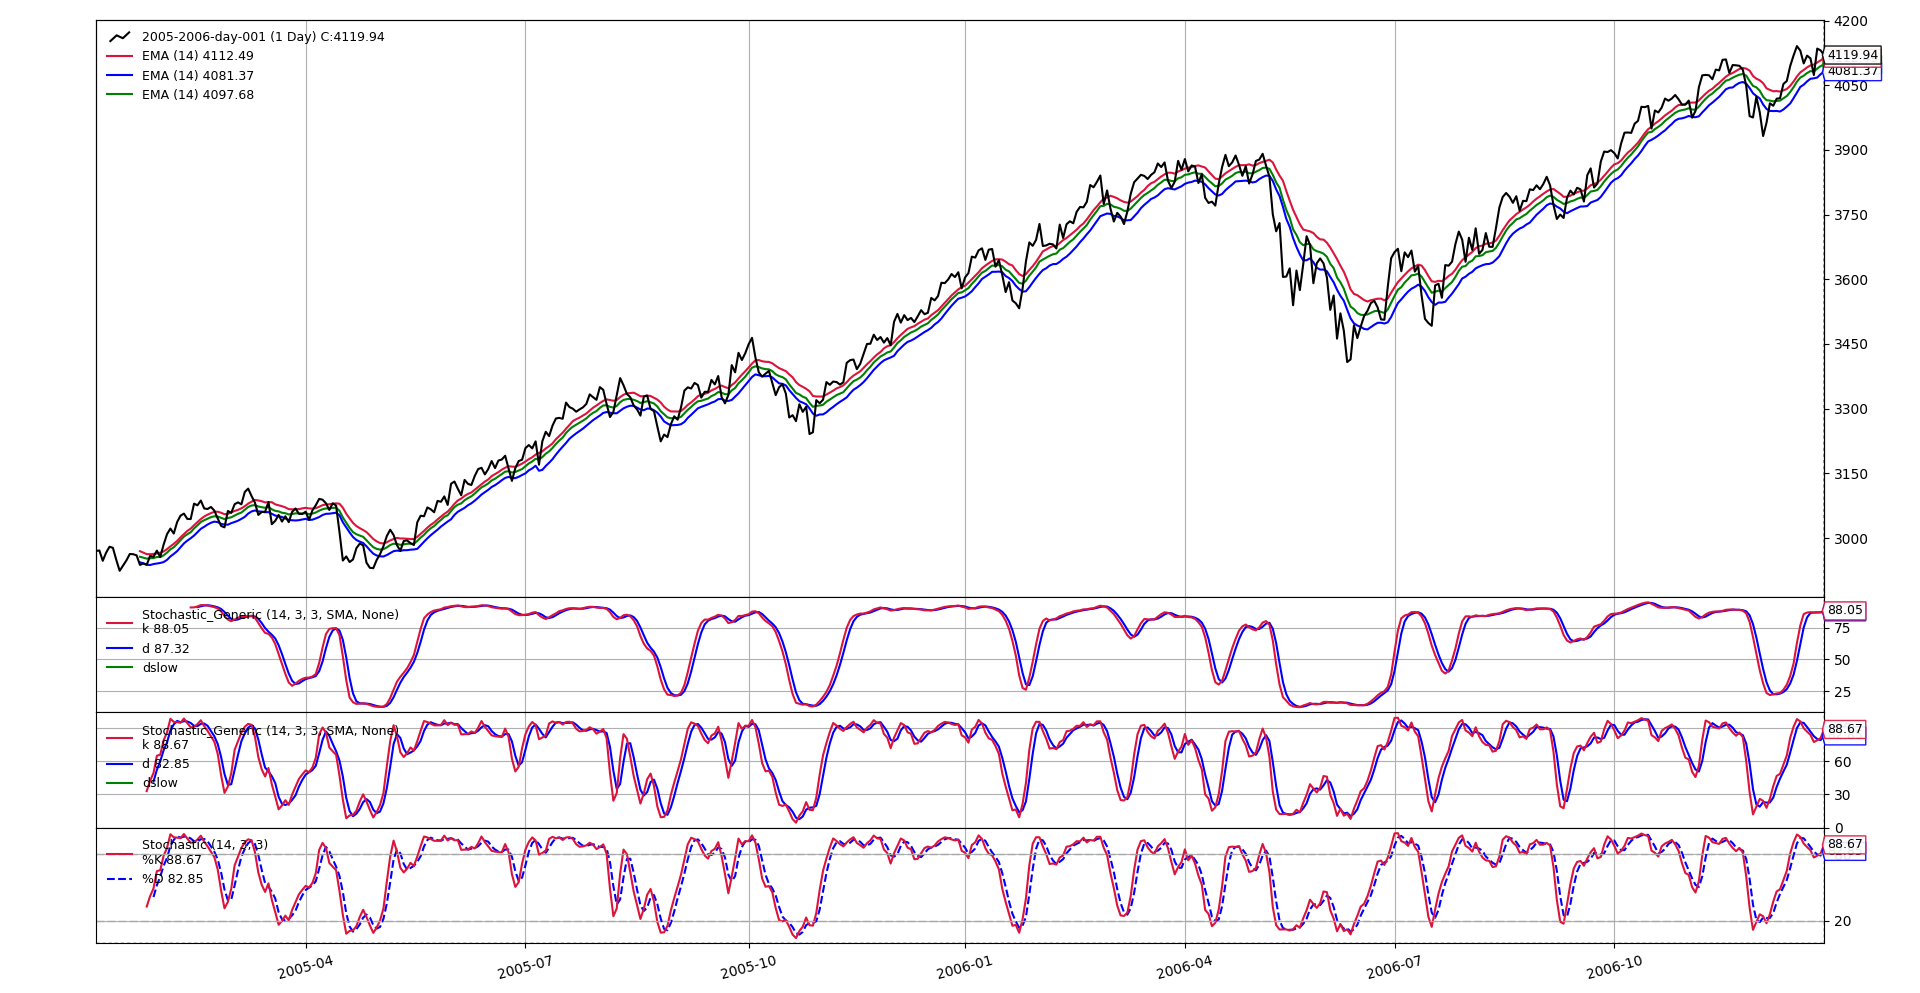
Of course, one needs to verify that this indicator does actually yield the same results as the standard indicator when given the same set of inputs. The chart below is created with this set of instructions
        # Generate 3 data feeds
        d0 = bt.ind.EMA(self.data.high, period=14)
        d1 = bt.ind.EMA(self.data.low, period=14)
        d2 = bt.ind.EMA(self.data.close, period=14)

        Stochastic_Generic(d0, d1, d2)  # customized stochastic

        # These two have generate the same results
        Stochastic_Generic(self.data.high, self.data.low, self.data.close)
        bt.ind.Stochastic(self.data)
And here a view of how the indicator works