Extending an Indicator
In Object Oriented Programming, and of course in Python itself, extension of an existing class can be achieved in two ways.
-
Inheritance (or subclassing)
-
Composition (or embedding)
In Developing an Indicator, the indicator Trix was developed in just
a couple lines of code. The ChartSchool - Trix
reference literature has a Trix with a signal line showing the similarities
with MACD.
Let’s “compose” MyTrixSignal using the already developed Trix
class MyTrixSignalComposed(bt.Indicator):

    lines = ('trix', 'signal')
    params = (('period', 15), ('sigperiod', 9))

    def __init__(self):
        self.lines.trix = MyTrix(self.data, period=self.p.period)
        self.lines.signal = btind.EMA(self.lines.trix, period=self.p.sigperiod)
Some things had to be repeated in the definition such as the name of the
trix line and the period to use for calculation. A new line signal
and the corresponding sigperiod parameter have been defined.
The 2-liner is a good result.
Now let’s go for inheritance, but first recalling how Trix looks like:
class MyTrix(bt.Indicator):

    lines = ('trix',)
    params = (('period', 15),)

    def __init__(self):
        ema1 = btind.EMA(self.data, period=self.p.period)
        ema2 = btind.EMA(ema1, period=self.p.period)
        ema3 = btind.EMA(ema2, period=self.p.period)

        self.lines.trix = 100.0 * (ema3 - ema3(-1)) / ema3(-1)
Using Trix as the base class, this is the aspect of TrixSignal
class MyTrixSignalInherited(MyTrix):

    lines = ('signal',)
    params = (('sigperiod', 9),)

    def __init__(self):
        super(MyTrixSignalInherited, self).__init__()
        self.lines.signal = btind.EMA(self.lines.trix, period=self.p.sigperiod)
The inherited indicator ends up also being a 2-liner but:
-
No redefinition of the
trixline is needed -
No redefinition of the
periodparameter is needed
Both are inherited from the base class Trix. And the calculation of the
trix line is done in the base class __init__ method:
- super(MyTrixSignalInherited, self).init()
The choice of composition vs inheritance is a classic. This example is not meant to clarify which is better but more to show that:
Note
Inheritance works even in the presence of the metadefinitions of lines and params, which also inherit from the metadefinitions of the base class
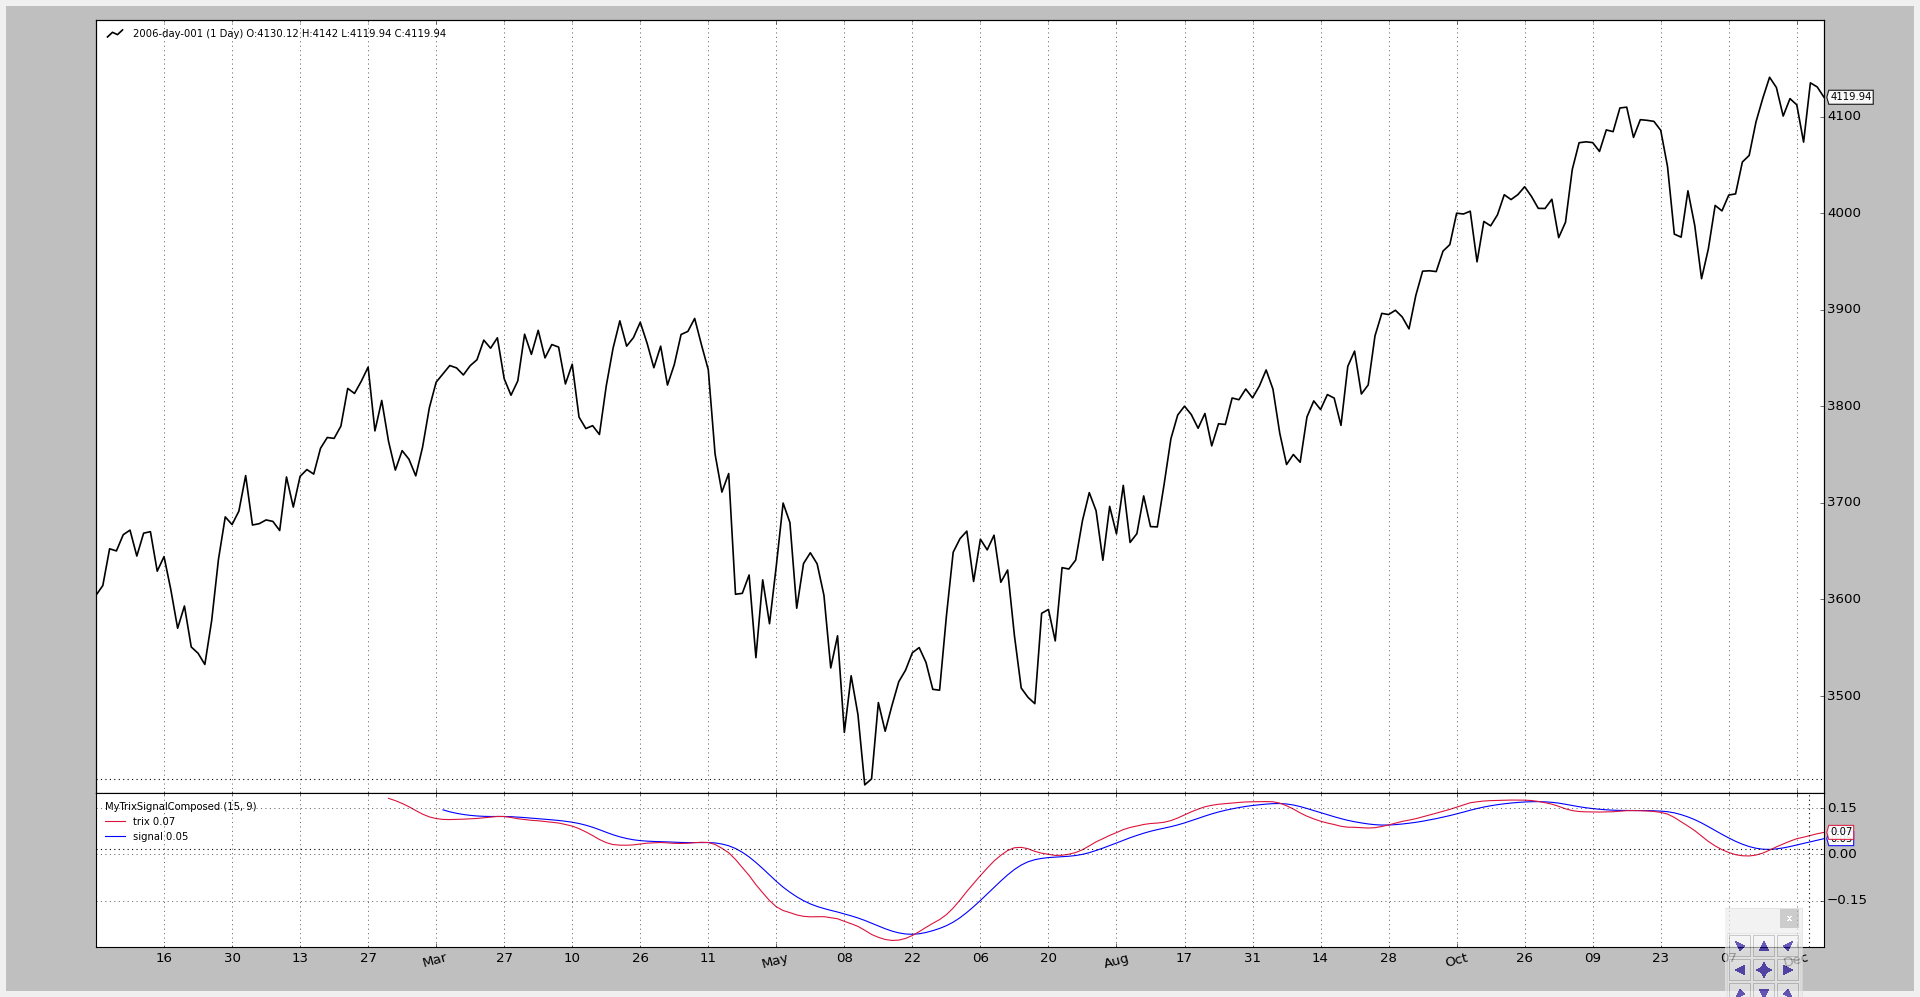
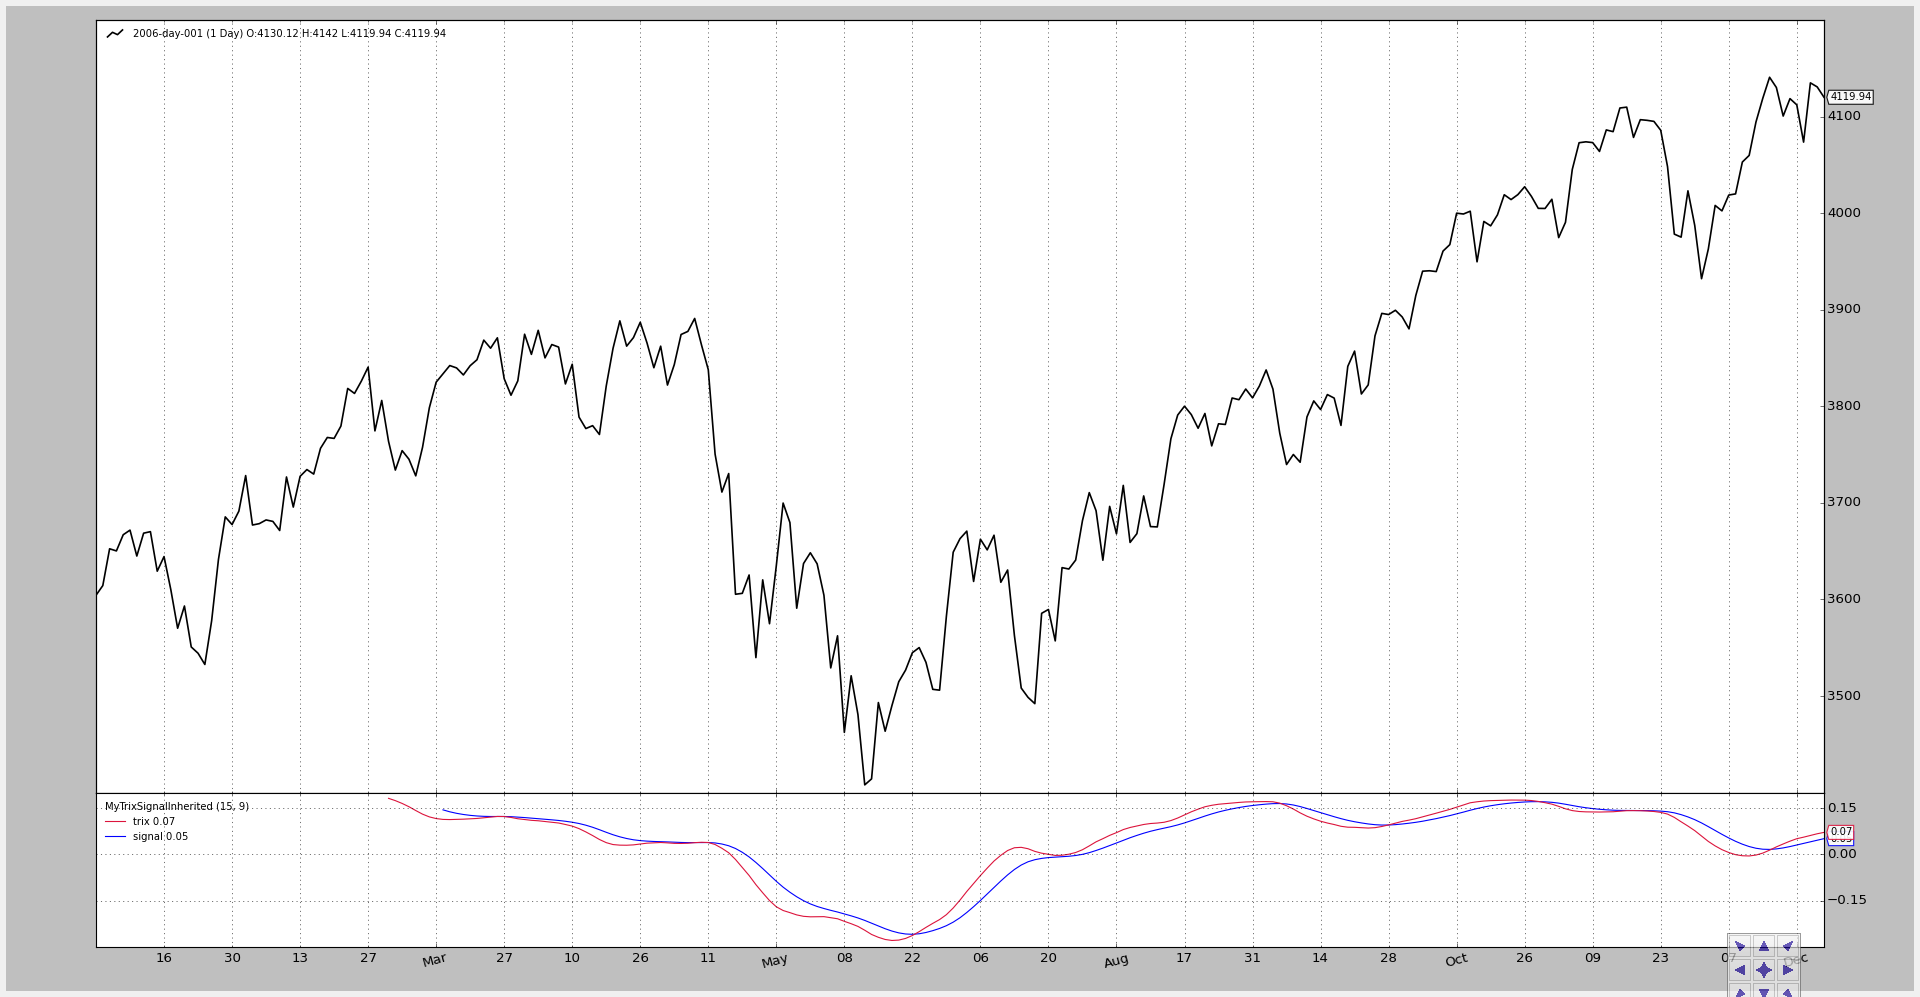
And finally the code and charts for both versions when put in action.
- The first one shows the inherited version
from __future__ import (absolute_import, division, print_function,
                        unicode_literals)

import backtrader as bt
import backtrader.feeds as btfeeds

from mytrix import MyTrixSignalInherited


class NoStrategy(bt.Strategy):
    params = (('trixperiod', 15),
              ('analyzer', False),)

    def __init__(self):
        MyTrixSignalInherited(self.data, period=self.p.trixperiod)


if __name__ == '__main__':
    # Create a cerebro entity
    cerebro = bt.Cerebro()

    # Add a strategy
    cerebro.addstrategy(NoStrategy, trixperiod=15)

    # Create a Data Feed
    datapath = ('../datas/2006-day-001.txt')
    data = bt.feeds.BacktraderCSVData(dataname=datapath)

    # Add the Data Feed to Cerebro
    cerebro.adddata(data)

    # Run over everything
    cerebro.run()

    # Plot the result
    cerebro.plot()
- The first one shows the composed version
from __future__ import (absolute_import, division, print_function,
                        unicode_literals)

import backtrader as bt
import backtrader.feeds as btfeeds

from mytrix import MyTrixSignalComposed


class NoStrategy(bt.Strategy):
    params = (('trixperiod', 15),
              ('analyzer', False),)

    def __init__(self):
        MyTrixSignalComposed(self.data, period=self.p.trixperiod)


if __name__ == '__main__':
    # Create a cerebro entity
    cerebro = bt.Cerebro()

    # Add a strategy
    cerebro.addstrategy(NoStrategy, trixperiod=15)

    # Create a Data Feed
    datapath = ('../datas/2006-day-001.txt')
    data = bt.feeds.BacktraderCSVData(dataname=datapath)

    # Add the Data Feed to Cerebro
    cerebro.adddata(data)

    # Run over everything
    cerebro.run()

    # Plot the result
    cerebro.plot()