Bar Synchronization
The lack of a standard formula in the literature and/or industry is not the problem, because the problem can actually be summarized as:
- Bar Synchronization
Ticket #23 raises some
questions as to whether backtrader can look into calculating
a RelativeVolume indicator.
The requester needs to compare the volume of a given moment in time against the same moment in time on the previous trading day. Including:
- Some pre-market data of unknown length
Having such a requirement invalidates the basic principle on which most indicators are built:
- Having a fixed period which is used to look backwards
Furthermore and given the comparison is done intraday, something else has to be taken into account:
-
Some of the “intraday” instants may be missing (be it minutes or seconds)
It is unlikely a data source will be missing a daily bar, but missing a minute or second bar is not that uncommon.
The main reason being that there may have not been any negotiation at all. Or they might have been a problem at the negotiation exchange which actually prevented the bar from being recorded at all.
Taking into account all the aforementioned points some conclusions for the development of the indicator:
-
The period is not a period in this case but a buffer to make sure enough bars will be there to have the indicator kick in as soon as possible
-
Some bars may be missing
-
The main issue is synchronization
Luckily there is a key which comes to the rescue to aid with the synchronization:
- Compared bars are “intraday” and hence counting the already seen days and the number of seen “bars” for a given moment of time enables synchronization
The previous day values are kept in a dictionary, because the “lookback” period as explained before is unknown.
Some other early ideas can be discarded, like for example implementing a
DataFilter data source because this would actually bring the data source out
of sync with other parts of the systme by removing the pre-market data. And the
synchronization problem would also be there.
An idea to be explored would be creating a DataFiller which would fill in
the missing minutes/seconds by using the last closing price and setting the
volume to 0.
Getting hands on has also proven good to identify some extra needs in
backtrader like a time2num function (an addition to the date2num and
num2date family) and what will become extra methods for the lines:
-
Extracting the “day” and “fraction” (time) of day parts from the floating point representation of the day
To be called “dt” and “tm”
In the meantime the code of the RelativeVolumeByBar indicator is presented
below. Having the”period”/”buffer” calculation inside the indicator is not the
preferred pattern, but it serves the purpose in this case.
from __future__ import (absolute_import, division, print_function,
                        unicode_literals)

import collections
import datetime
import math


import backtrader as bt


def time2num(tm):
    """
    Convert :mod:`time` to the to the preserving hours, minutes, seconds
    and microseconds.  Return value is a :func:`float`.
    """
    HOURS_PER_DAY = 24.0
    MINUTES_PER_HOUR = 60.0
    SECONDS_PER_MINUTE = 60.0
    MUSECONDS_PER_SECOND = 1e6
    MINUTES_PER_DAY = MINUTES_PER_HOUR * HOURS_PER_DAY
    SECONDS_PER_DAY = SECONDS_PER_MINUTE * MINUTES_PER_DAY
    MUSECONDS_PER_DAY = MUSECONDS_PER_SECOND * SECONDS_PER_DAY

    tm_num = (tm.hour / HOURS_PER_DAY +
              tm.minute / MINUTES_PER_DAY +
              tm.second / SECONDS_PER_DAY +
              tm.microsecond / MUSECONDS_PER_DAY)

    return tm_num


def dtime_dt(dt):
    return math.trunc(dt)


def dtime_tm(dt):
    return math.modf(dt)[0]


class RelativeVolumeByBar(bt.Indicator):
    alias = ('RVBB',)
    lines = ('rvbb',)

    params = (
        ('prestart', datetime.time(8, 00)),
        ('start', datetime.time(9, 10)),
        ('end', datetime.time(17, 15)),
    )

    def _plotlabel(self):
        plabels = []
        for name, value in self.params._getitems():
            plabels.append('%s: %s' % (name, value.strftime('%H:%M')))

        return plabels

    def __init__(self):
        # Inform the platform about the minimum period needs
        minbuffer = self._calcbuffer()
        self.addminperiod(minbuffer)

        # Structures/variable to keep synchronization
        self.pvol = dict()
        self.vcount = collections.defaultdict(int)

        self.days = 0
        self.dtlast = 0

        # Keep the start/end times in numeric format for comparison
        self.start = time2num(self.p.start)
        self.end = time2num(self.p.end)

        # Done after calc to ensure coop inheritance and composition work
        super(RelativeVolumeByBar, self).__init__()

    def _barisvalid(self, tm):
        return self.start <= tm <= self.end

    def _daycount(self):
        dt = dtime_dt(self.data.datetime[0])
        if dt > self.dtlast:
            self.days += 1
            self.dtlast = dt

    def prenext(self):
        self._daycount()

        tm = dtime_tm(self.data.datetime[0])
        if self._barisvalid(tm):
            self.pvol[tm] = self.data.volume[0]
            self.vcount[tm] += 1

    def next(self):
        self._daycount()

        tm = dtime_tm(self.data.datetime[0])
        if not self._barisvalid(tm):
            return

        # Record the "minute/second" of this day has been seen
        self.vcount[tm] += 1

        # Get the bar's volume
        vol = self.data.volume[0]

        # If number of days is right, we saw the same "minute/second" last day
        if self.vcount[tm] == self.days:
            self.lines.rvbb[0] = vol / self.pvol[tm]

        # Synchronize the days and volume count for next cycle
        self.vcount[tm] = self.days

        # Record the volume for this bar for next cycle
        self.pvol[tm] = vol

    def _calcbuffer(self):
        # Period calculation
        minend = self.p.end.hour * 60 + self.p.end.minute
        # minstart = session_start.hour * 60 + session_start.minute
        # use prestart to account for market_data
        minstart = self.p.prestart.hour * 60 + self.p.prestart.minute

        minbuffer = minend - minstart

        tframe = self.data._timeframe
        tcomp = self.data._compression

        if tframe == bt.TimeFrame.Seconds:
            minbuffer = (minperiod * 60)

        minbuffer = (minbuffer // tcomp) + tcomp

        return minbuffer
Invoked through an script, which can be used as follows:
$ ./relative-volume.py --help
usage: relative-volume.py [-h] [--data DATA] [--prestart PRESTART]
                          [--start START] [--end END] [--fromdate FROMDATE]
                          [--todate TODATE] [--writer] [--wrcsv] [--plot]
                          [--numfigs NUMFIGS]

MultiData Strategy

optional arguments:
  -h, --help            show this help message and exit
  --data DATA, -d DATA  data to add to the system
  --prestart PRESTART   Start time for the Session Filter
  --start START         Start time for the Session Filter
  --end END, -te END    End time for the Session Filter
  --fromdate FROMDATE, -f FROMDATE
                        Starting date in YYYY-MM-DD format
  --todate TODATE, -t TODATE
                        Starting date in YYYY-MM-DD format
  --writer, -w          Add a writer to cerebro
  --wrcsv, -wc          Enable CSV Output in the writer
  --plot, -p            Plot the read data
  --numfigs NUMFIGS, -n NUMFIGS
                        Plot using numfigs figures
A test invocation:
$ ./relative-volume.py --plot
Generates this chart:
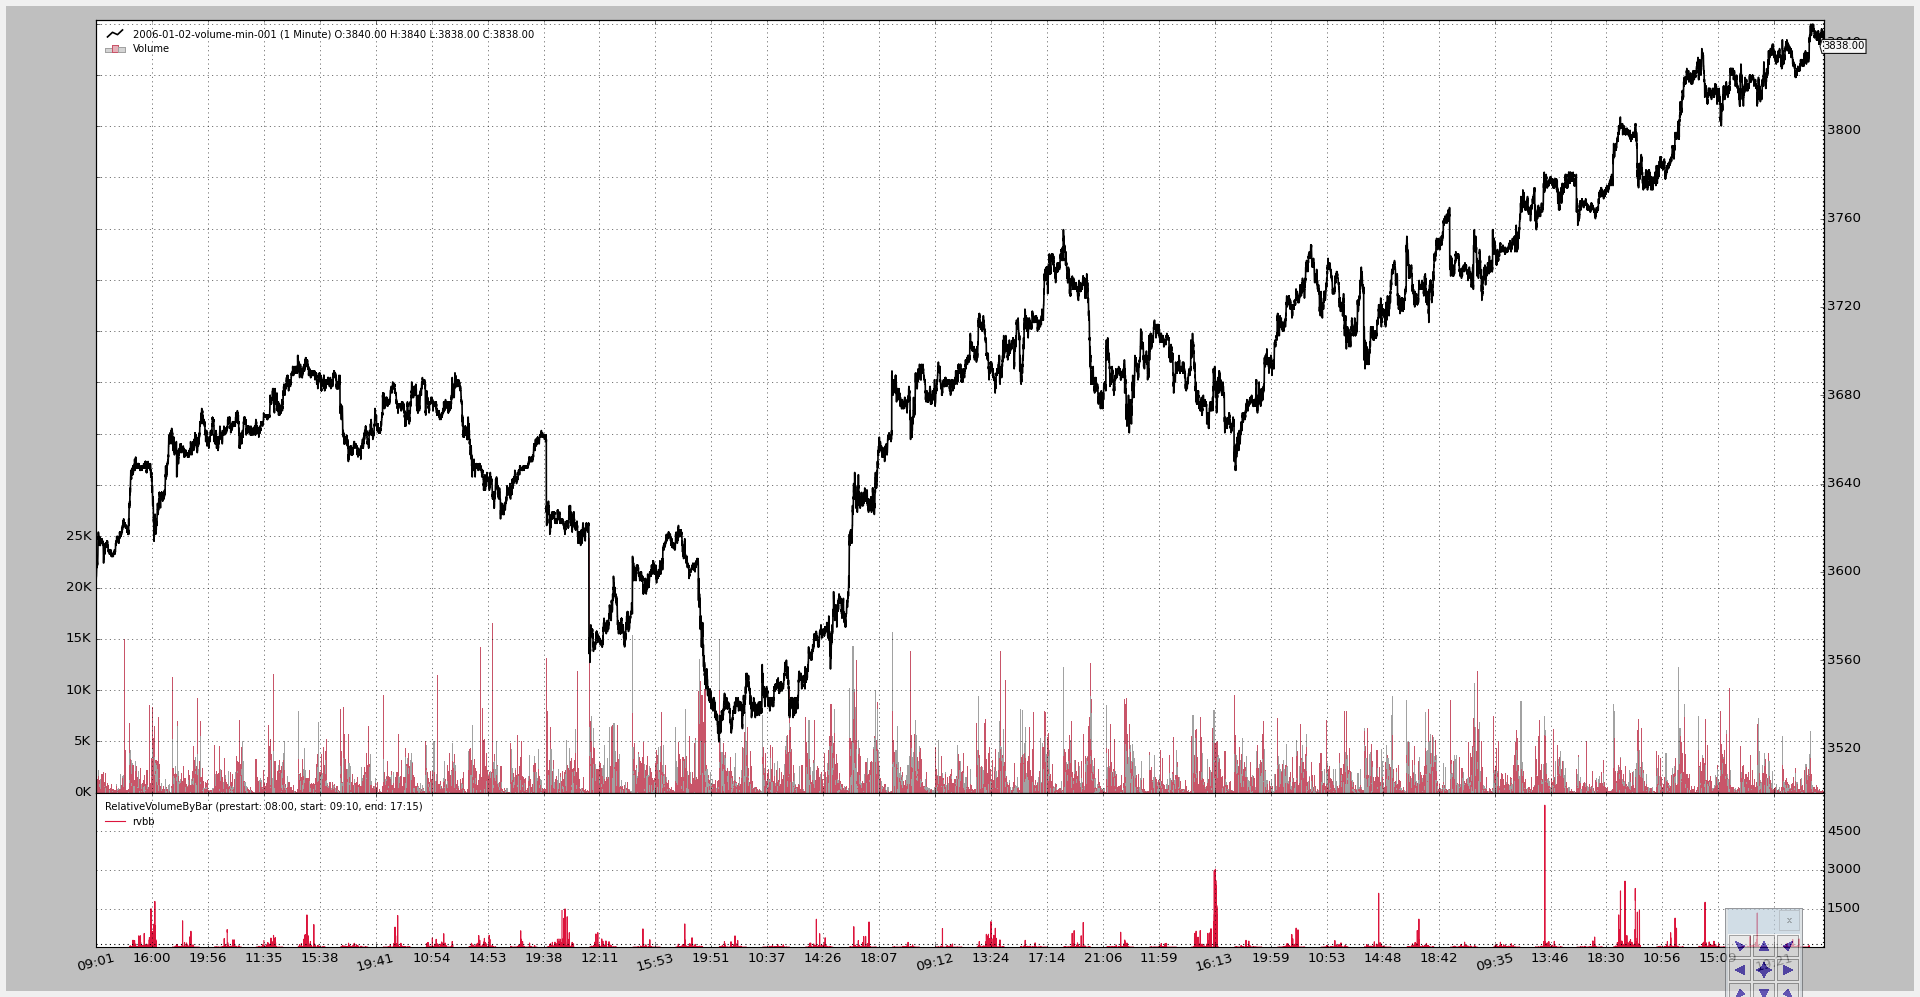
The code for the script.
from __future__ import (absolute_import, division, print_function,
                        unicode_literals)

import argparse
import datetime

# The above could be sent to an independent module
import backtrader as bt
import backtrader.feeds as btfeeds

from relvolbybar import RelativeVolumeByBar

def runstrategy():
    args = parse_args()

    # Create a cerebro
    cerebro = bt.Cerebro()

    # Get the dates from the args
    fromdate = datetime.datetime.strptime(args.fromdate, '%Y-%m-%d')
    todate = datetime.datetime.strptime(args.todate, '%Y-%m-%d')

    # Create the 1st data
    data = btfeeds.VChartCSVData(
        dataname=args.data,
        fromdate=fromdate,
        todate=todate,
        )

    # Add the 1st data to cerebro
    cerebro.adddata(data)

    # Add an empty strategy
    cerebro.addstrategy(bt.Strategy)

    # Get the session times to pass them to the indicator
    prestart = datetime.datetime.strptime(args.prestart, '%H:%M')
    start = datetime.datetime.strptime(args.start, '%H:%M')
    end = datetime.datetime.strptime(args.end, '%H:%M')

    # Add the Relative volume indicator
    cerebro.addindicator(RelativeVolumeByBar,
                         prestart=prestart, start=start, end=end)

    # Add a writer with CSV
    if args.writer:
        cerebro.addwriter(bt.WriterFile, csv=args.wrcsv)

    # And run it
    cerebro.run(stdstats=False)

    # Plot if requested
    if args.plot:
        cerebro.plot(numfigs=args.numfigs, volume=True)


def parse_args():
    parser = argparse.ArgumentParser(description='MultiData Strategy')

    parser.add_argument('--data', '-d',
                        default='../../datas/2006-01-02-volume-min-001.txt',
                        help='data to add to the system')

    parser.add_argument('--prestart',
                        default='08:00',
                        help='Start time for the Session Filter')

    parser.add_argument('--start',
                        default='09:15',
                        help='Start time for the Session Filter')

    parser.add_argument('--end', '-te',
                        default='17:15',
                        help='End time for the Session Filter')

    parser.add_argument('--fromdate', '-f',
                        default='2006-01-01',
                        help='Starting date in YYYY-MM-DD format')

    parser.add_argument('--todate', '-t',
                        default='2006-12-31',
                        help='Starting date in YYYY-MM-DD format')

    parser.add_argument('--writer', '-w', action='store_true',
                        help='Add a writer to cerebro')

    parser.add_argument('--wrcsv', '-wc', action='store_true',
                        help='Enable CSV Output in the writer')

    parser.add_argument('--plot', '-p', action='store_true',
                        help='Plot the read data')

    parser.add_argument('--numfigs', '-n', default=1,
                        help='Plot using numfigs figures')

    return parser.parse_args()


if __name__ == '__main__':
    runstrategy()