Mixing Timeframes in Indicators
Release 1.3.0.92 brings up the possibility to have data (from either data feeds and/or indicators) from different timeframes mixed.
Background: Indicators are smart dumb objects.
-
They are smart because they can make complex calculations.
-
They are dumb because they operate with no knowledge of what sources are providing the data for the calculations
As such:
- If the data sources providing the values have different timeframes,
different lengths inside the
Cerebroengine, the indicator will break.
Example of a calculation, in which data0 has a timeframe of days and
data1 has a timeframe of months:
pivotpoint = btind.PivotPoint(self.data1)
sellsignal = self.data0.close < pivotpoint.s1
Here a sell signal is sought when the close is below the s1 line (1st
support)
Note
PivotPoint works in a larger timeframe by definition
This will in the past with the following error:
return self.array[self.idx + ago]
IndexError: array index out of range
And for a good reason: self.data.close provides values from the very 1st
instant, but PivotPoint (and hence the s1 line) will only deliver
values once a full month has gone by, which is roughly equivalent to 22
values of self.data0.close. During this 22 closes there isn’t yet a value
for s1 and the attempt to fetch it from the underlying array fails.
Lines objects support the (ago) operator (__call__ special method in
Python) for deliver a delayed version of itself:
close1 = self.data.close(-1)
In this example the object close1 (when accessed via [0]) always contains
the previous value (-1) delivered by close. The syntax has been
reused to accomodate adapting timeframes. Let’s rewrite the above
pivotpoint snippet:
pivotpoint = btind.PivotPoint(self.data1)
sellsignal = self.data0.close < pivotpoint.s1()
See how the () is executed with no arguments (in the background a None
is being supplied). The following is happening:
pivotpoint.s1()is returning an internalLinesCouplerobject which follows the rhythm of the larger scope. This coupler fills itself with the latest delivered value from the reals1(starting with a default value ofNaN)
But something extra is needed to make the magic work. Cerebro has to be
created with:
cerebro = bt.Cerebro(runonce=False)
or executed with:
cerebro.run(runonce=False)
In this mode the indicators and late-evaluated automatic lines objects are executed step by step rather than in tight loops. This makes the entire operation slower, but it makes it possible
The sample script at the bottom which was breaking above, now runs:
$ ./mixing-timeframes.py
With output:
0021,0021,0001,2005-01-31,2984.75,2935.96,0.00
0022,0022,0001,2005-02-01,3008.85,2935.96,0.00
...
0073,0073,0003,2005-04-15,3013.89,3010.76,0.00
0074,0074,0003,2005-04-18,2947.79,3010.76,1.00
...
At line 74 the 1st instance of close < s1 takes place.
The script also provides insight into the additional possiblity: couple all lines of an indicator. Before we had:
self.sellsignal = self.data0.close < pp.s1()
Being the alternative:
pp1 = pp()
self.sellsignal = self.data0.close < pp1.s1
Now the entire PivotPoint indicator has been coupled and any of its lines
can be accessed (namely p, r1, r2, s1, s2). The script has
only interest in s1 and the access is direct.:
$ ./mixing-timeframes.py --multi
The output:
0021,0021,0001,2005-01-31,2984.75,2935.96,0.00
0022,0022,0001,2005-02-01,3008.85,2935.96,0.00
...
0073,0073,0003,2005-04-15,3013.89,3010.76,0.00
0074,0074,0003,2005-04-18,2947.79,3010.76,1.00
...
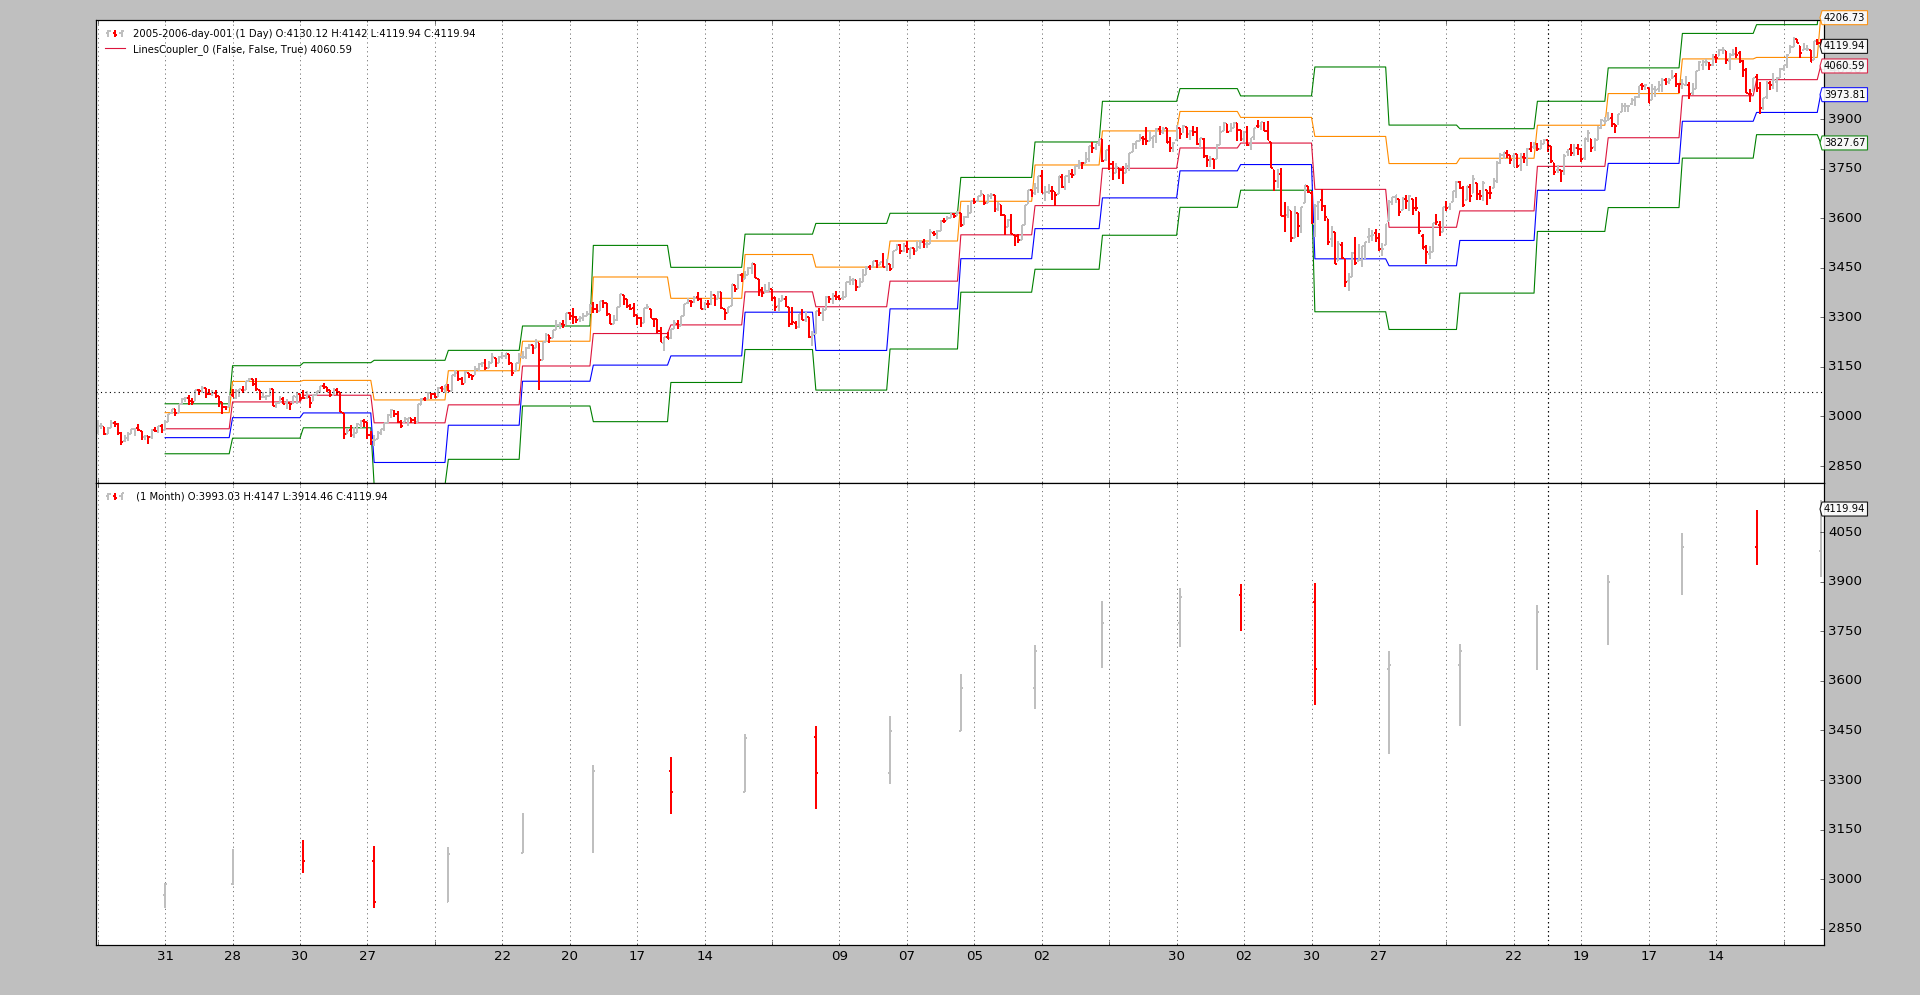
No surprises here. The same as before. The “coupled” object can even be plotted:
$ ./mixing-timeframes.py --multi --plot
Full coupling syntax
For lines objects with multiple lines (for example Indicators like
PivotPoint):
-
obj(clockref=None, line=-1)clockrefIfclockrefisNone, the surrounding object (in the examples aStrategy) will be the reference to adapt larger timeframes (for example:Months) to smaller/faster timeframes (for example:Days)
Another reference can be used if desired
line* If the default `-1` is given, all *lines* are coupled. * If another integer (for example, `0` or `1`) a single line will be coupled and fetched by index (from `obj.lines[x]`) * If a string is passed, the line will be fetched by name. In the sample, the following could have been done: ```python coupled_s1 = pp(line='s1') ```
For lines objects with a single line (for example line s1 from the
indicator PivotPoint):
obj(clockref=None)(see above forclockref)
Conclusion
Integrated in the regular () syntax, data feeds from different timeframes can be
mixed in indicators, always taking into account that cerebro needs to be
instantiated or created with runonce=False.
Script Code and Usage
Available as sample in the sources of backtrader. Usage:
$ ./mixing-timeframes.py --help
usage: mixing-timeframes.py [-h] [--data DATA] [--multi] [--plot]

Sample for pivot point and cross plotting

optional arguments:
  -h, --help   show this help message and exit
  --data DATA  Data to be read in (default: ../../datas/2005-2006-day-001.txt)
  --multi      Couple all lines of the indicator (default: False)
  --plot       Plot the result (default: False)
The code:
from __future__ import (absolute_import, division, print_function,
                        unicode_literals)

import argparse

import backtrader as bt
import backtrader.feeds as btfeeds
import backtrader.indicators as btind
import backtrader.utils.flushfile


class St(bt.Strategy):
    params = dict(multi=True)

    def __init__(self):
        self.pp = pp = btind.PivotPoint(self.data1)
        pp.plotinfo.plot = False  # deactivate plotting

        if self.p.multi:
            pp1 = pp()  # couple the entire indicators
            self.sellsignal = self.data0.close < pp1.s1
        else:
            self.sellsignal = self.data0.close < pp.s1()

    def next(self):
        txt = ','.join(
            ['%04d' % len(self),
             '%04d' % len(self.data0),
             '%04d' % len(self.data1),
             self.data.datetime.date(0).isoformat(),
             '%.2f' % self.data0.close[0],
             '%.2f' % self.pp.s1[0],
             '%.2f' % self.sellsignal[0]])

        print(txt)


def runstrat():
    args = parse_args()

    cerebro = bt.Cerebro()
    data = btfeeds.BacktraderCSVData(dataname=args.data)
    cerebro.adddata(data)
    cerebro.resampledata(data, timeframe=bt.TimeFrame.Months)

    cerebro.addstrategy(St, multi=args.multi)

    cerebro.run(stdstats=False, runonce=False)
    if args.plot:
        cerebro.plot(style='bar')


def parse_args():
    parser = argparse.ArgumentParser(
        formatter_class=argparse.ArgumentDefaultsHelpFormatter,
        description='Sample for pivot point and cross plotting')

    parser.add_argument('--data', required=False,
                        default='../../datas/2005-2006-day-001.txt',
                        help='Data to be read in')

    parser.add_argument('--multi', required=False, action='store_true',
                        help='Couple all lines of the indicator')

    parser.add_argument('--plot', required=False, action='store_true',
                        help=('Plot the result'))

    return parser.parse_args()


if __name__ == '__main__':
    runstrat()