Plotting on the same axis
The previous post future-spot, was plotting the original data and the slightly (randomly) modified data on the same space, but not on the same axis.
Recovering the 1st picture from that post.
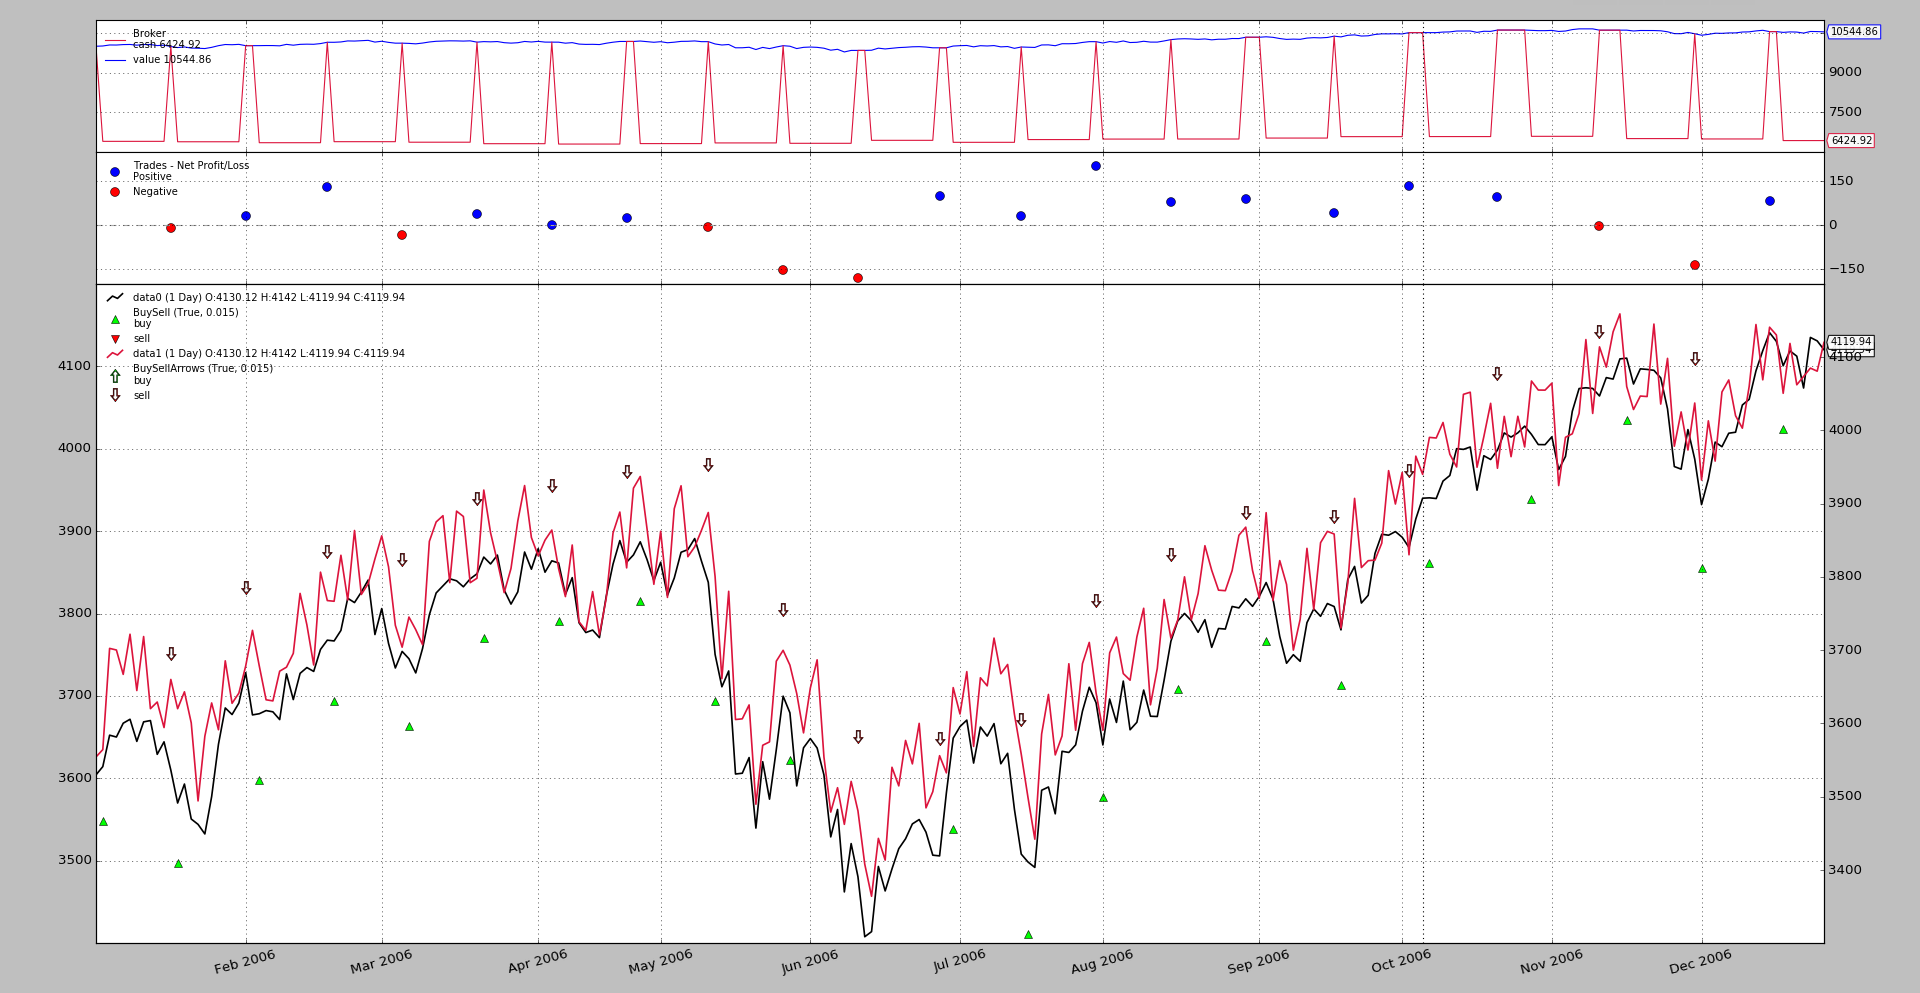
One can see:
-
There are different scales on the left and right hand sides of the chart
-
This is most obvious when looking at the swinging red line (the randomized data) which oscillates
+- 50points around the original data.On the chart the visual impression is that this randomized data is mostly always above the original data. Which is only a visual impression due to the different scales.
Although release 1.9.32.116 already had some initial support to fully plot
on the same axis, the legend labels would be duplicated (only the labels, not
the data) which was really confusing.
Release 1.9.33.116 cures that effect and allows full plotting on the same
axis. The usage pattern is like the one to decide with which other data to
plot. From the previous post.
import backtrader as bt

cerebro = bt.Cerebro()

data0 = bt.feeds.MyFavouriteDataFeed(dataname='futurename')
cerebro.adddata(data0)

data1 = bt.feeds.MyFavouriteDataFeed(dataname='spotname')
data1.compensate(data0)  # let the system know ops on data1 affect data0
data1.plotinfo.plotmaster = data0
data1.plotinfo.sameaxis = True
cerebro.adddata(data1)

...

cerebro.run()
data1 gets some plotinfo values to:
-
Plot on the same space as
plotmasterwhich isdata0 -
Get the indication to use the
sameaxisThe reason for this indication is that the platform cannot know in advance if the scales for each data will be compatible. That’s why it will plot them on independent scales
The previous sample gets an additional option to plot on the sameaxis. A
sample execution:
$ ./future-spot.py --sameaxis
And the resulting chart
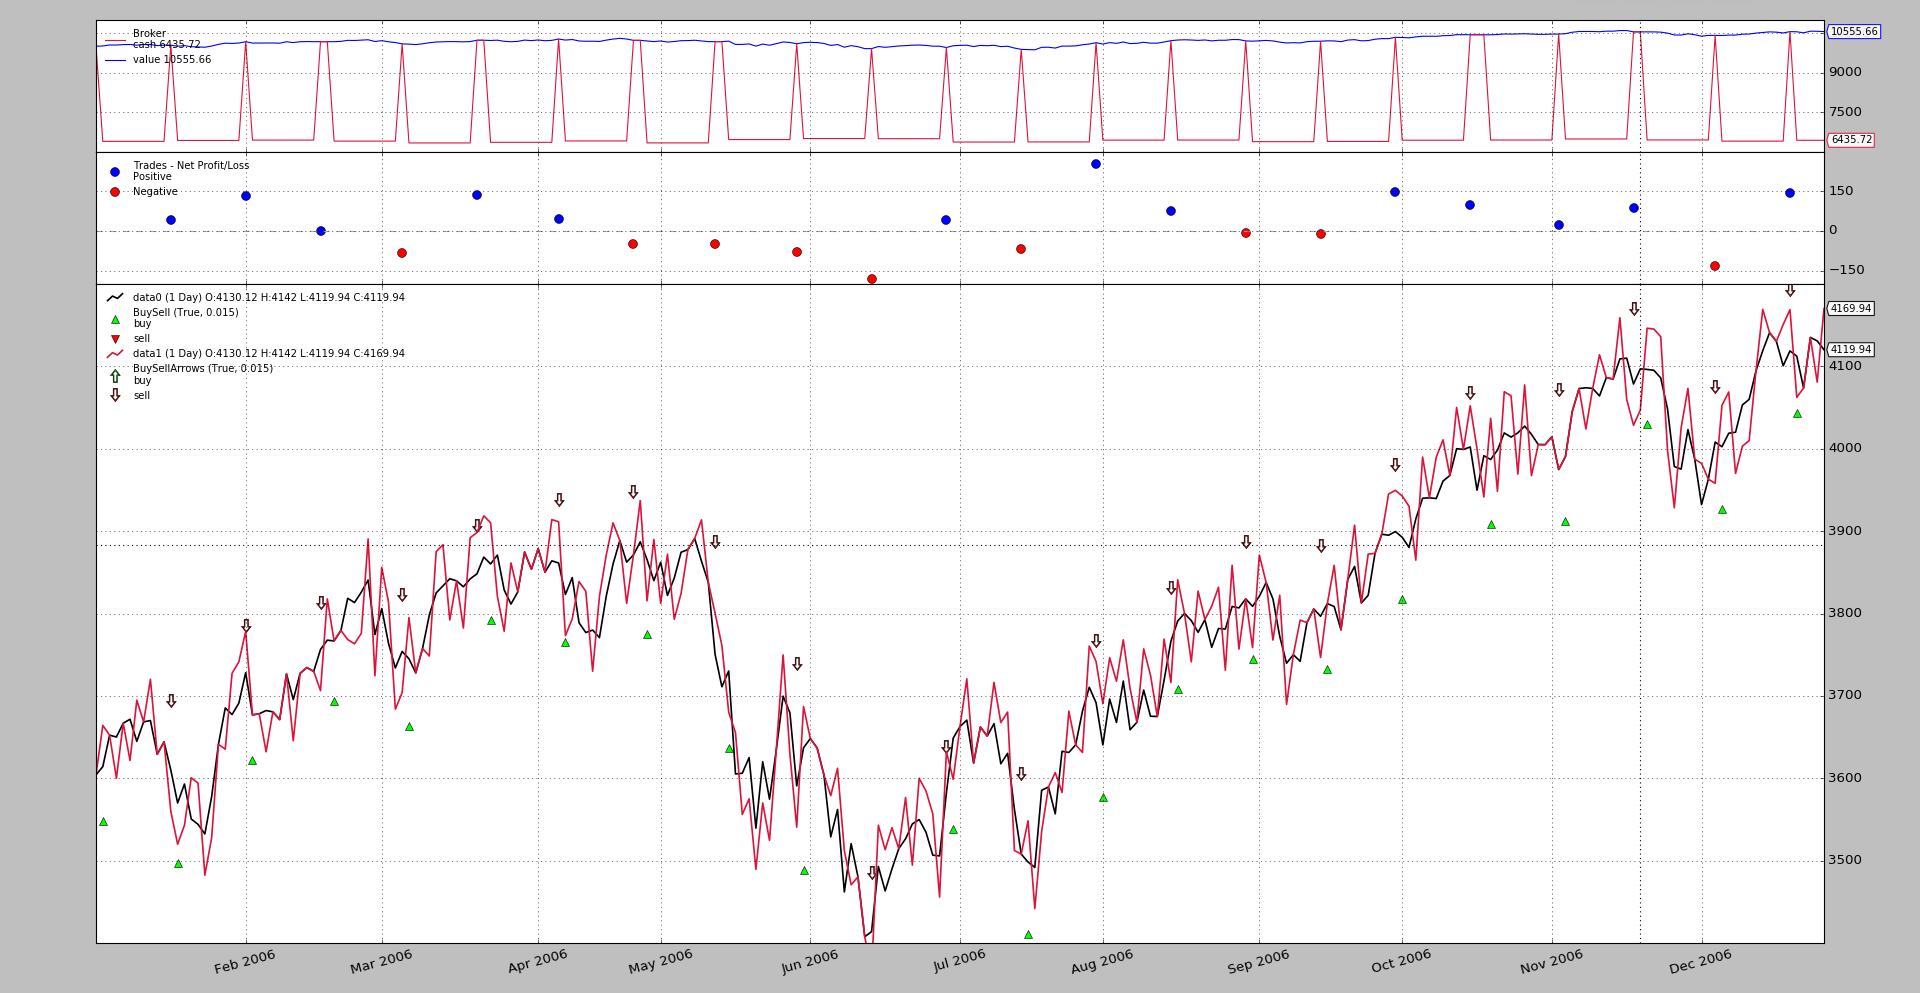
To notice:
-
Only one scale on the right hand side
-
And now the randomized data seems to clearly oscillate around the original data which is the expected visual behavior
Sample Usage
$ ./future-spot.py --help
usage: future-spot.py [-h] [--no-comp] [--sameaxis]

Compensation example

optional arguments:
  -h, --help  show this help message and exit
  --no-comp
  --sameaxis
Sample Code
from __future__ import (absolute_import, division, print_function,
                        unicode_literals)

import argparse
import random
import backtrader as bt


# The filter which changes the close price
def close_changer(data, *args, **kwargs):
    data.close[0] += 50.0 * random.randint(-1, 1)
    return False  # length of stream is unchanged


# override the standard markers
class BuySellArrows(bt.observers.BuySell):
    plotlines = dict(buy=dict(marker='$\u21E7$', markersize=12.0),
                     sell=dict(marker='$\u21E9$', markersize=12.0))


class St(bt.Strategy):
    def __init__(self):
        bt.obs.BuySell(self.data0, barplot=True)  # done here for
        BuySellArrows(self.data1, barplot=True)  # different markers per data

    def next(self):
        if not self.position:
            if random.randint(0, 1):
                self.buy(data=self.data0)
                self.entered = len(self)

        else:  # in the market
            if (len(self) - self.entered) >= 10:
                self.sell(data=self.data1)


def runstrat(args=None):
    args = parse_args(args)
    cerebro = bt.Cerebro()

    dataname = '../../datas/2006-day-001.txt'  # data feed

    data0 = bt.feeds.BacktraderCSVData(dataname=dataname, name='data0')
    cerebro.adddata(data0)

    data1 = bt.feeds.BacktraderCSVData(dataname=dataname, name='data1')
    data1.addfilter(close_changer)
    if not args.no_comp:
        data1.compensate(data0)
    data1.plotinfo.plotmaster = data0
    if args.sameaxis:
        data1.plotinfo.sameaxis = True
    cerebro.adddata(data1)

    cerebro.addstrategy(St)  # sample strategy

    cerebro.addobserver(bt.obs.Broker)  # removed below with stdstats=False
    cerebro.addobserver(bt.obs.Trades)  # removed below with stdstats=False

    cerebro.broker.set_coc(True)
    cerebro.run(stdstats=False)  # execute
    cerebro.plot(volume=False)  # and plot


def parse_args(pargs=None):
    parser = argparse.ArgumentParser(
        formatter_class=argparse.ArgumentDefaultsHelpFormatter,
        description=('Compensation example'))

    parser.add_argument('--no-comp', required=False, action='store_true')
    parser.add_argument('--sameaxis', required=False, action='store_true')
    return parser.parse_args(pargs)


if __name__ == '__main__':
    runstrat()