Plotting on the same axis
Following a comment on the blog a slight addition (luckily just a few lines of code) has been made to plotting.
- The abilitiy to plot any indicator on any other indicator
A potential use case:
-
Saving precious screen real estate by plotting some indicators together and having more room to appreciate the OHLC bars
Example: join Stochastic and RSI plots
Of course something has to be taken into account:
-
If the scaling of the indicators is too different, some of the indicators would not be visible.
Example: a MACD oscillating around 0.0 plus/minus 0.5 plotted over a Stochastic which moves across the 0-100 range.
The first implementation is in the development branch on commit …14252c6
A sample script (see below for the full code) let us see the effects
Note
Because the sample strategy does nothing, the standards observers are removed unless activated via a command line switch.
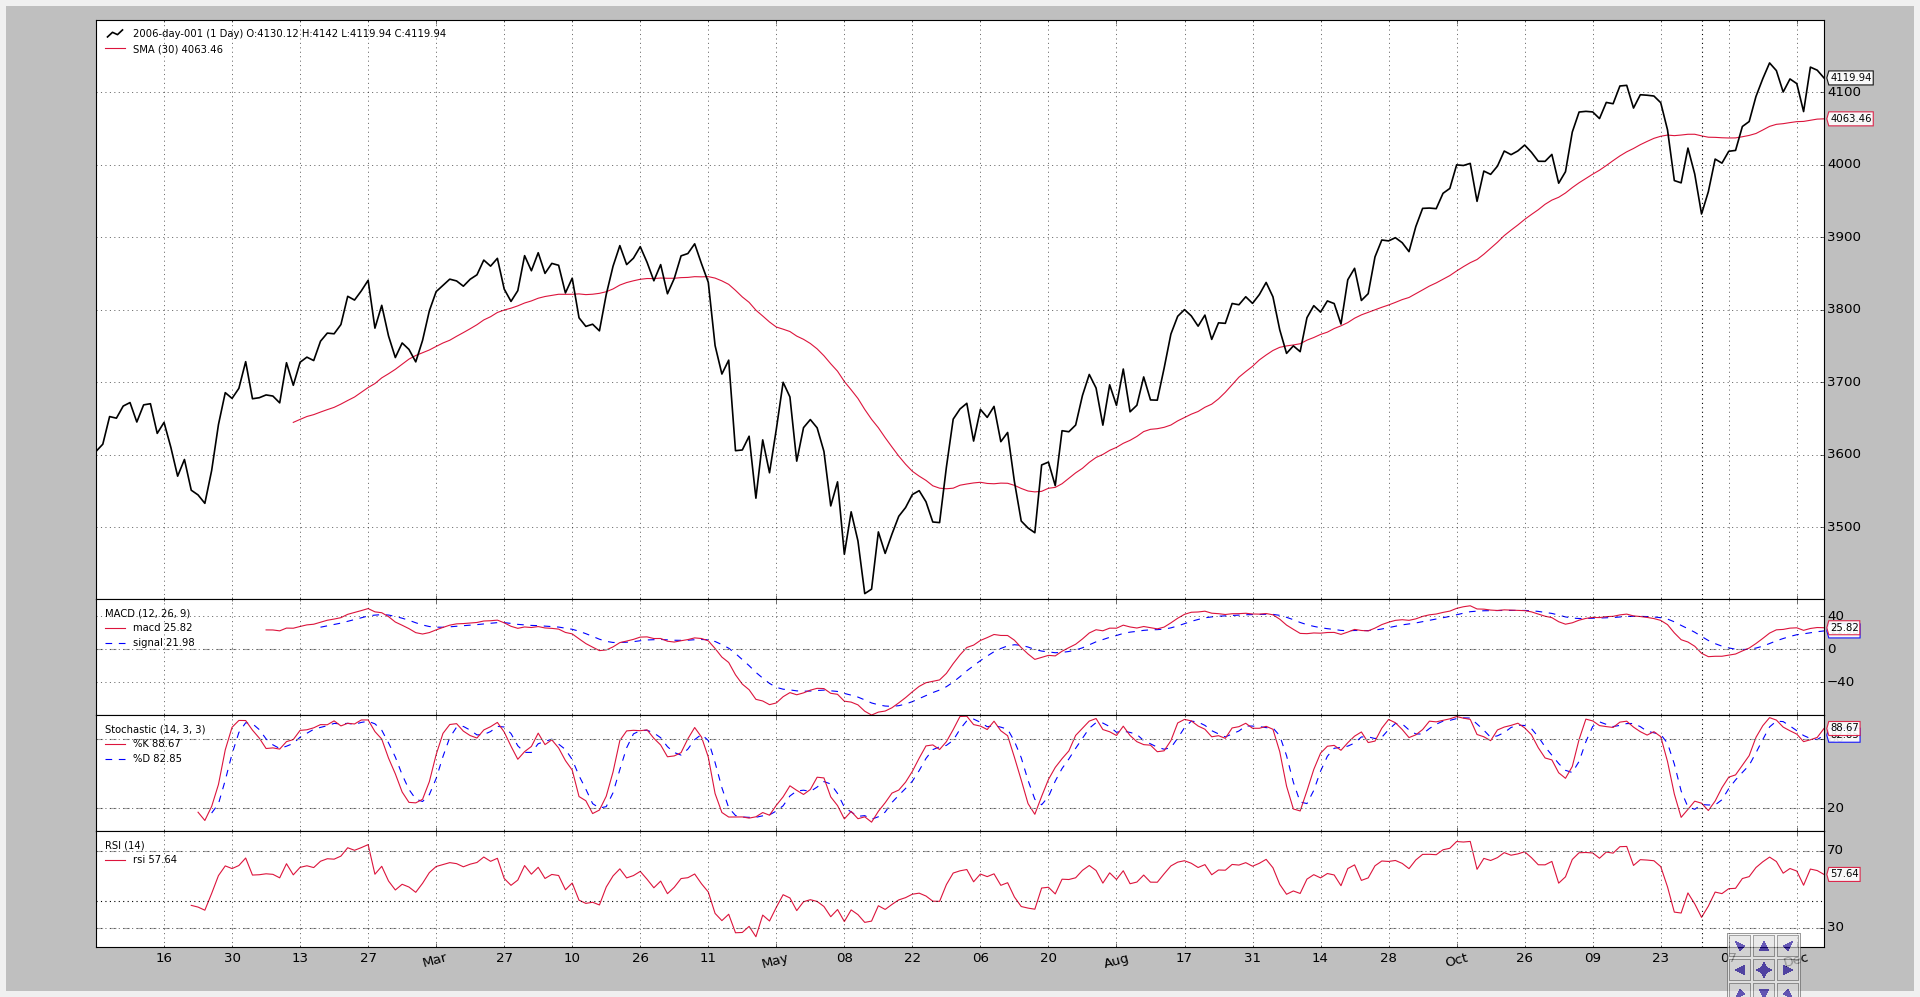
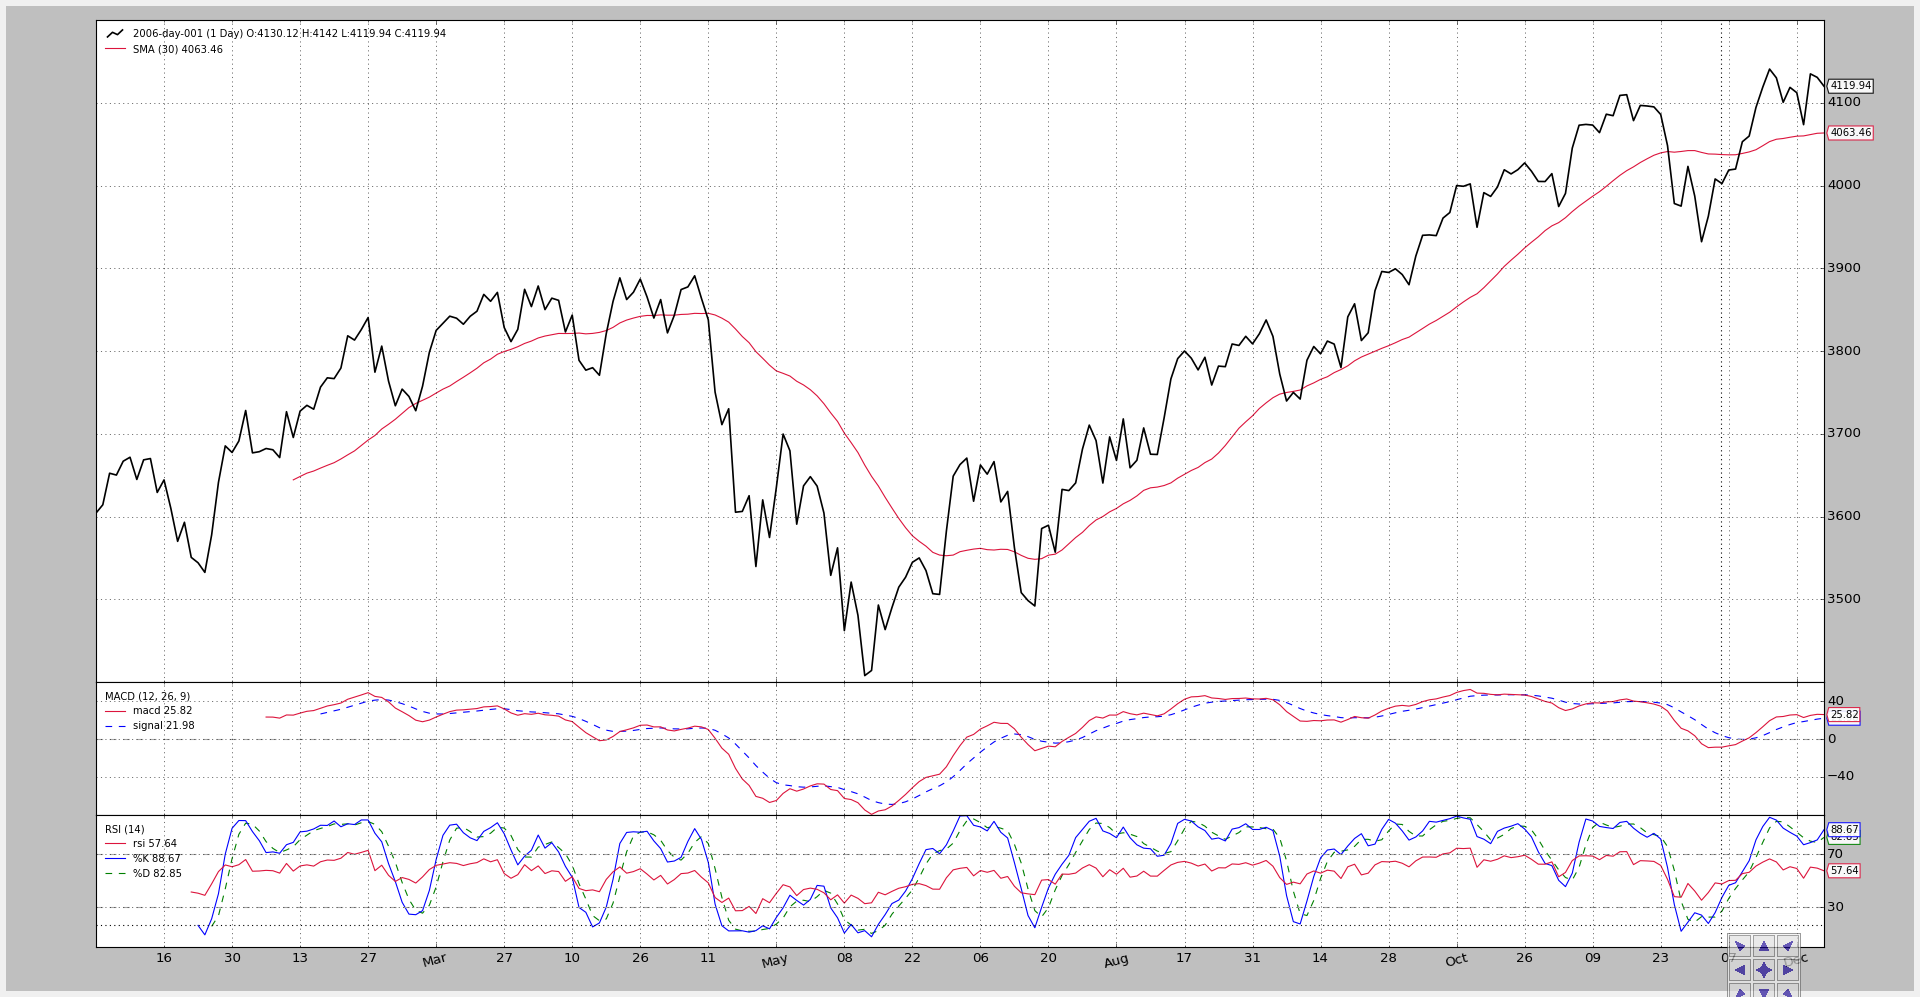
First the script run with no switches.
-
A Simple Moving Average is plotted over the data
-
A MACD, Stochastic and RSI are plotted on own axis/subplots
Execution:
$ ./plot-same-axis.py
And the chart.
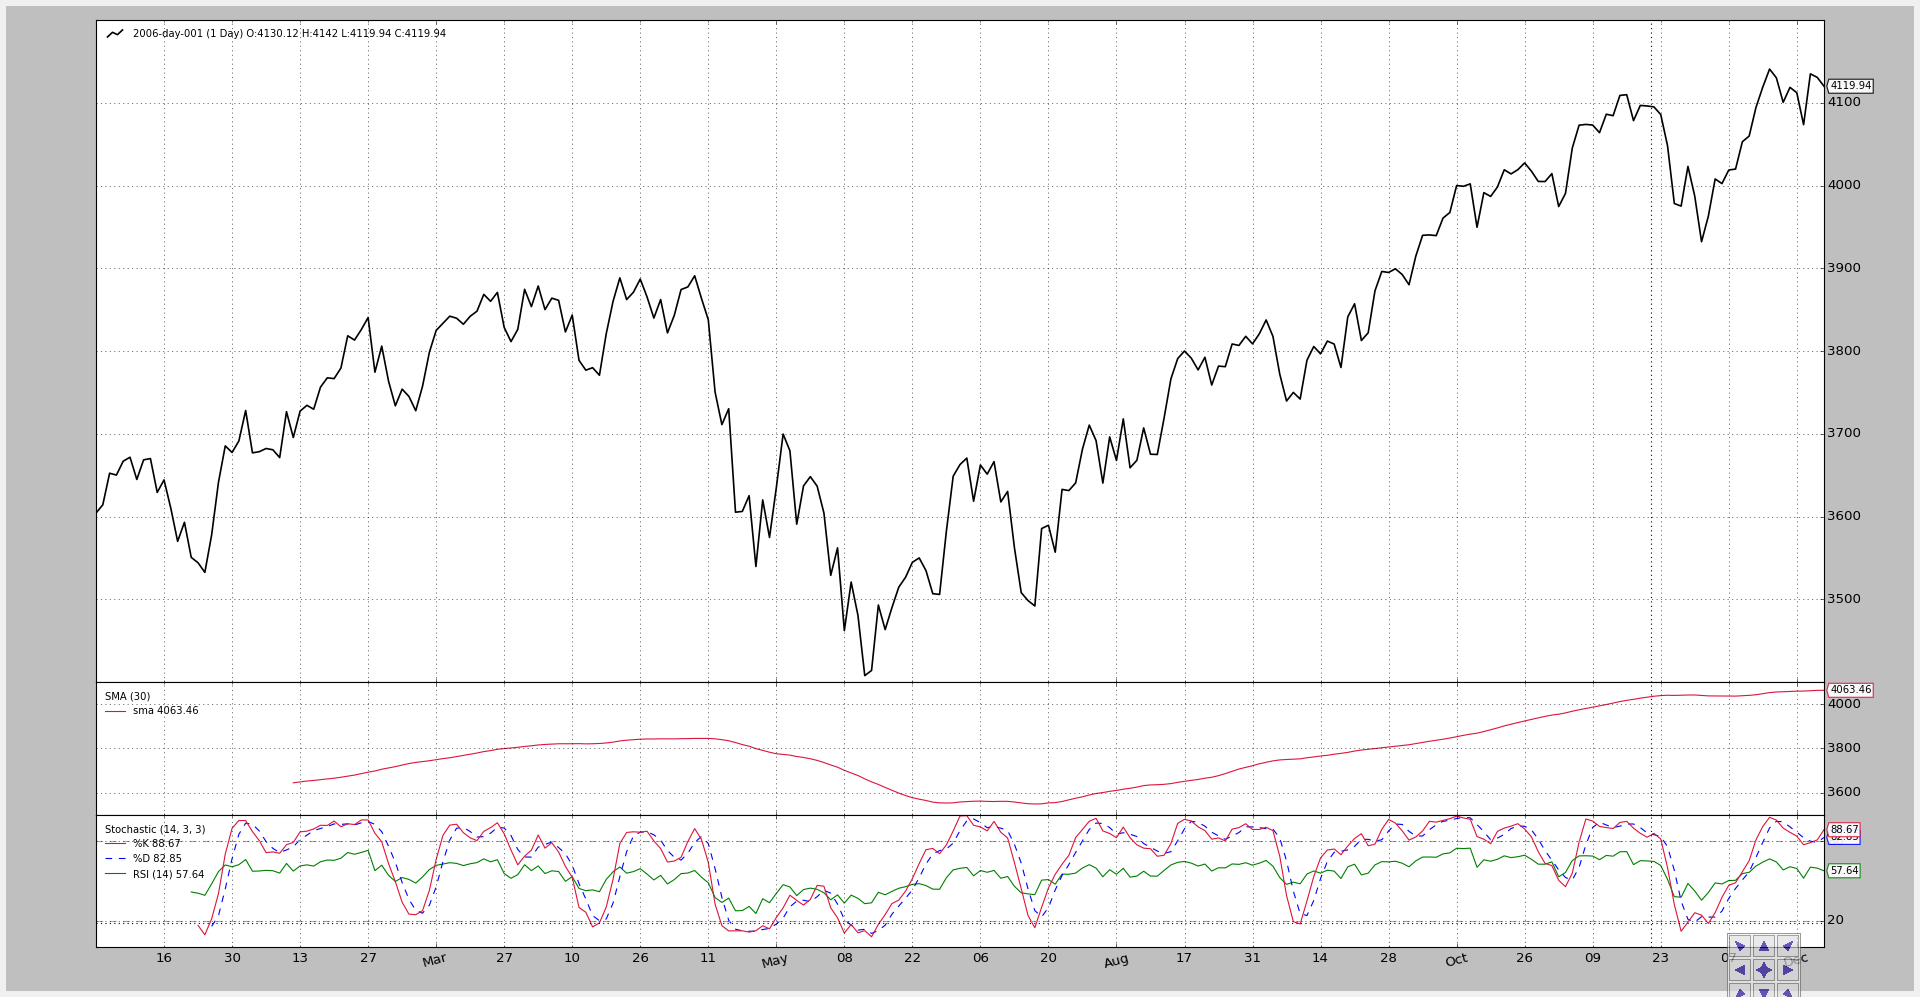
The second execution changes the panorama:
-
The Simple Moving Average is moved to a subplot
-
The MACD is hidden
-
The RSI is plotted over the Stochastic (the y-axis range is compatible: 0-100)
This is achieved by setting the
plotinfo.plotmastervalue of the indicator to the other indicator to be plotted onto.In this case and because the local variables in
__init__are namedstocfor Stochastic andrsifor RSI, it looks like:rsi.plotinfo.plotmaster = stoc
Execution:
$ ./plot-same-axis.py --smasubplot --nomacdplot --rsioverstoc
The chart.
And to check the incompatibility of scales, let’s try plotting the rsi over the SMA:
$ ./plot-same-axis.py --rsiovermacd
The chart.
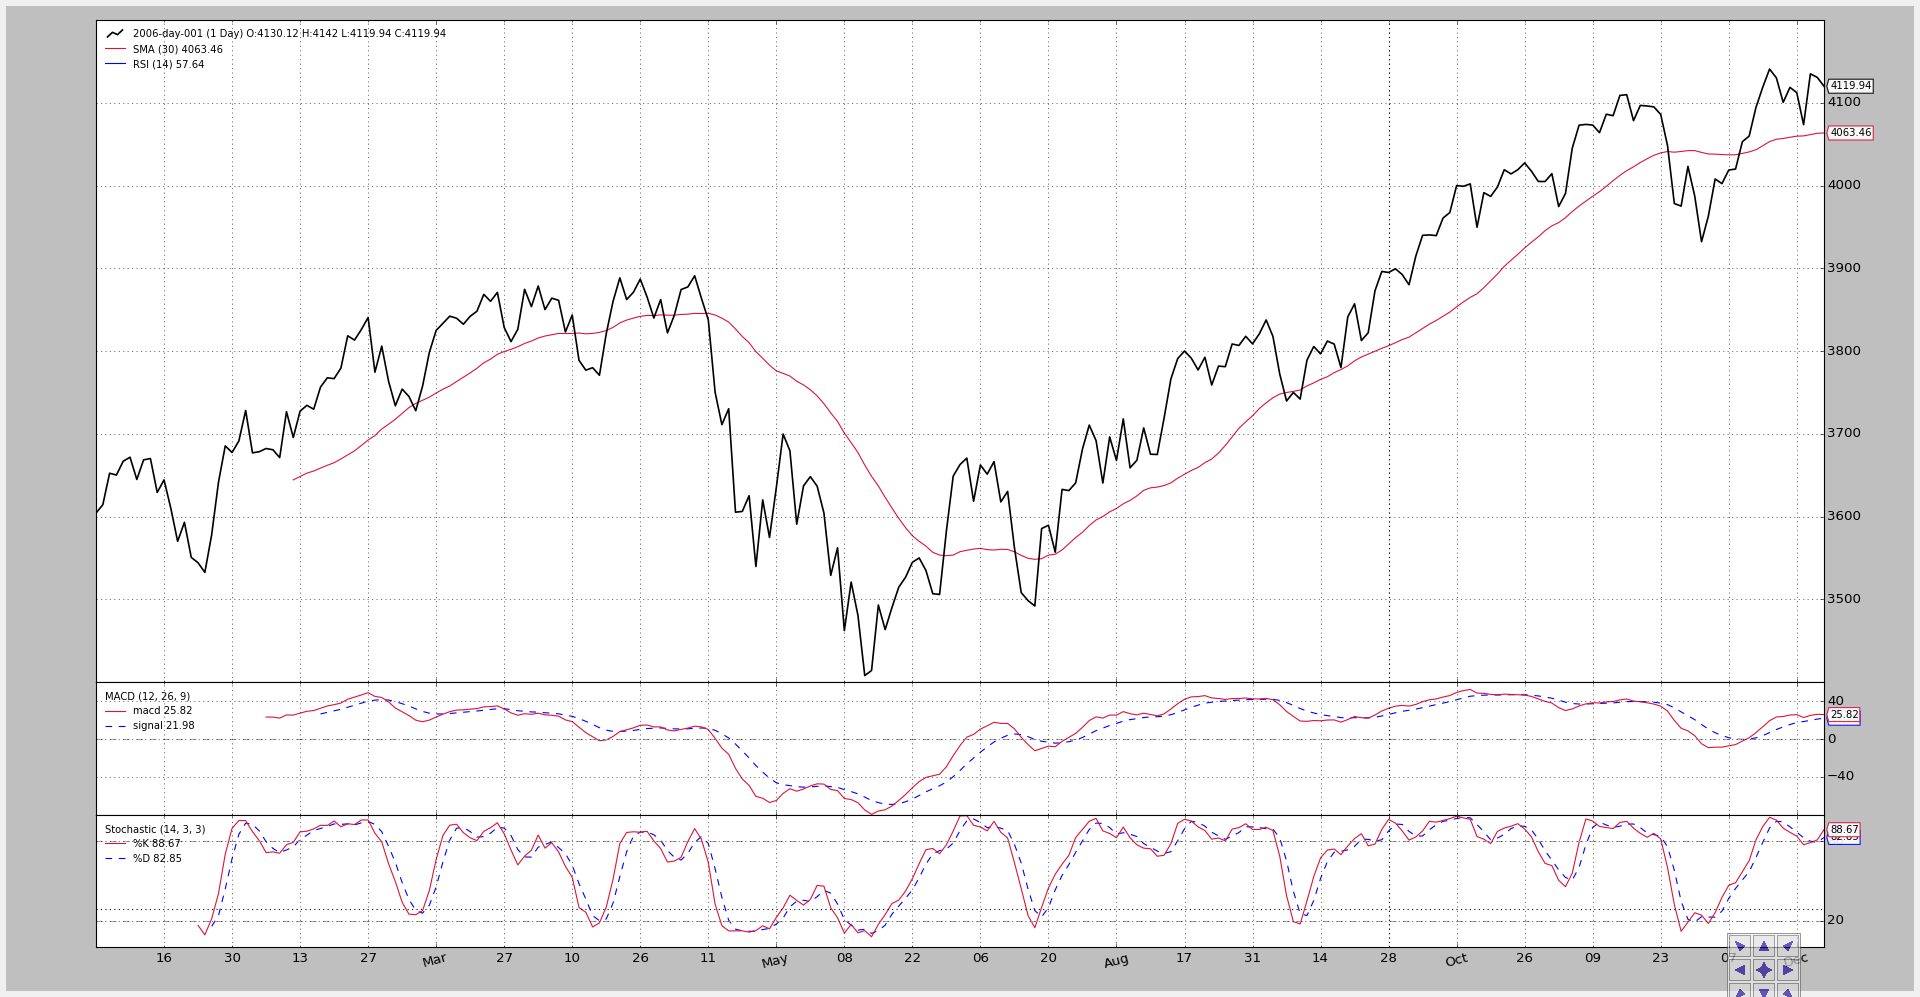
The RSI label shows up with the data and the SMA, but the scale is in the 3400-4200 range and hence … no traces of the RSI.
A further futile attempt is to place the SMA on a subplot and again plot the RSI on the SMA
$ ./plot-same-axis.py –rsiovermacd –smasubplot
The chart.
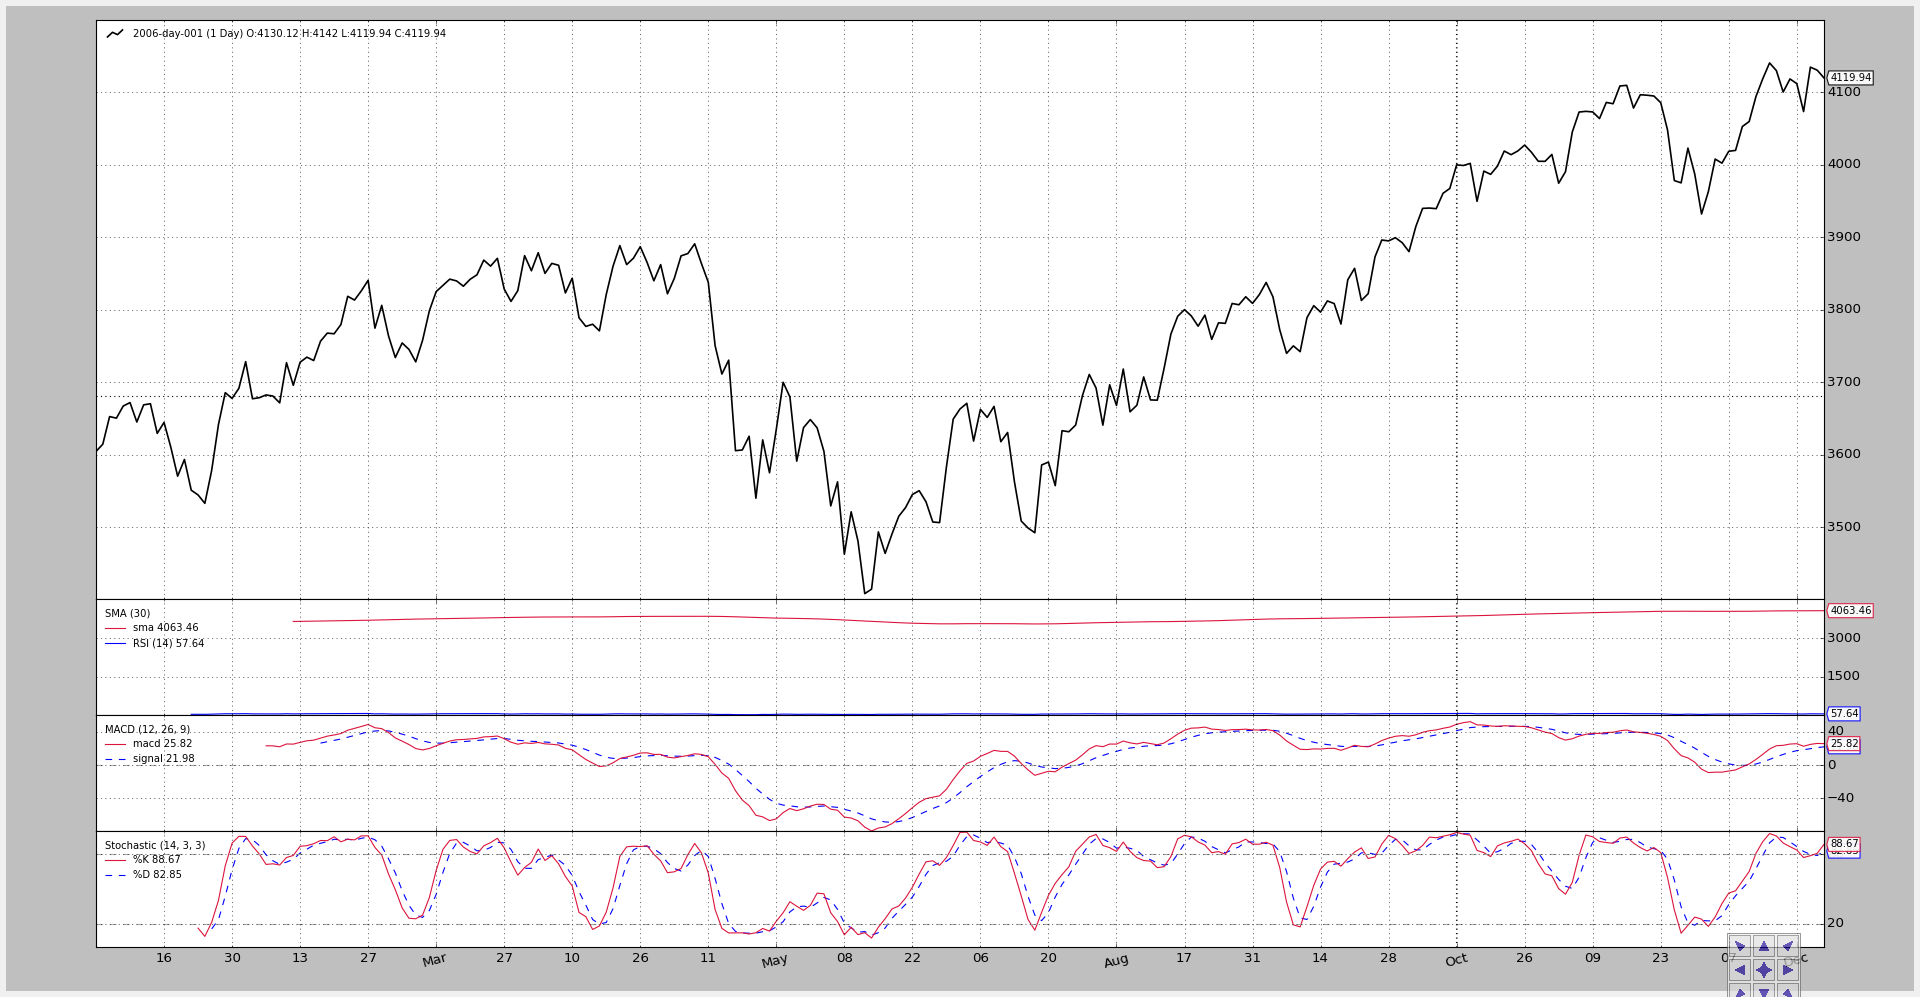
The label is clear but all that remains from the RSI is a faint blue line at the bottom of the SMA plot.
Note
Added multi-line indicator plotted over another indicator
Going in the other direction, let’s plot a multi-line indicator on another indicator. Let’s plot the Stochastic on the RSI:
$ ./plot-same-axis.py --stocrsi

It works. The Stochastic label shows up and the 2 lines K% and D%
too. But the lines are not “named” because we have got the name of the
indicator.
In the code, the current setting would be:
stoc.plotinfo.plotmaster = rsi
To have the names of the Stochastic lines displayed instead of the name, we would additionally need:
stoc.plotinfo.plotlinelabels = True
This has been parametrized and a new execution shows it:
$ ./plot-same-axis.py --stocrsi --stocrsilabels
With the chart now showing the name of the Stochasti lines below the name of the RSI line.
The script usage:
$ ./plot-same-axis.py --help
usage: plot-same-axis.py [-h] [--data DATA] [--fromdate FROMDATE]
                         [--todate TODATE] [--stdstats] [--smasubplot]
                         [--nomacdplot]
                         [--rsioverstoc | --rsioversma | --stocrsi]
                         [--stocrsilabels] [--numfigs NUMFIGS]

Plotting Example

optional arguments:
  -h, --help            show this help message and exit
  --data DATA, -d DATA  data to add to the system
  --fromdate FROMDATE, -f FROMDATE
                        Starting date in YYYY-MM-DD format
  --todate TODATE, -t TODATE
                        Starting date in YYYY-MM-DD format
  --stdstats, -st       Show standard observers
  --smasubplot, -ss     Put SMA on own subplot/axis
  --nomacdplot, -nm     Hide the indicator from the plot
  --rsioverstoc, -ros   Plot the RSI indicator on the Stochastic axis
  --rsioversma, -rom    Plot the RSI indicator on the SMA axis
  --stocrsi, -strsi     Plot the Stochastic indicator on the RSI axis
  --stocrsilabels       Plot line names instead of indicator name
  --numfigs NUMFIGS, -n NUMFIGS
                        Plot using numfigs figures
And the code.
from __future__ import (absolute_import, division, print_function,
                        unicode_literals)

import argparse
import datetime

# The above could be sent to an independent module
import backtrader as bt
import backtrader.feeds as btfeeds
import backtrader.indicators as btind


class PlotStrategy(bt.Strategy):
    '''
    The strategy does nothing but create indicators for plotting purposes
    '''
    params = dict(
        smasubplot=False,  # default for Moving averages
        nomacdplot=False,
        rsioverstoc=False,
        rsioversma=False,
        stocrsi=False,
        stocrsilabels=False,
    )

    def __init__(self):
        sma = btind.SMA(subplot=self.params.smasubplot)

        macd = btind.MACD()
        # In SMA we passed plot directly as kwarg, here the plotinfo.plot
        # attribute is changed - same effect
        macd.plotinfo.plot = not self.params.nomacdplot

        # Let's put rsi on stochastic/sma or the other way round
        stoc = btind.Stochastic()
        rsi = btind.RSI()
        if self.params.stocrsi:
            stoc.plotinfo.plotmaster = rsi
            stoc.plotinfo.plotlinelabels = self.p.stocrsilabels
        elif self.params.rsioverstoc:
            rsi.plotinfo.plotmaster = stoc
        elif self.params.rsioversma:
            rsi.plotinfo.plotmaster = sma


def runstrategy():
    args = parse_args()

    # Create a cerebro
    cerebro = bt.Cerebro()

    # Get the dates from the args
    fromdate = datetime.datetime.strptime(args.fromdate, '%Y-%m-%d')
    todate = datetime.datetime.strptime(args.todate, '%Y-%m-%d')

    # Create the 1st data
    data = btfeeds.BacktraderCSVData(
        dataname=args.data,
        fromdate=fromdate,
        todate=todate)

    # Add the 1st data to cerebro
    cerebro.adddata(data)

    # Add the strategy
    cerebro.addstrategy(PlotStrategy,
                        smasubplot=args.smasubplot,
                        nomacdplot=args.nomacdplot,
                        rsioverstoc=args.rsioverstoc,
                        rsioversma=args.rsioversma,
                        stocrsi=args.stocrsi,
                        stocrsilabels=args.stocrsilabels)

    # And run it
    cerebro.run(stdstats=args.stdstats)

    # Plot
    cerebro.plot(numfigs=args.numfigs, volume=False)


def parse_args():
    parser = argparse.ArgumentParser(description='Plotting Example')

    parser.add_argument('--data', '-d',
                        default='../../datas/2006-day-001.txt',
                        help='data to add to the system')

    parser.add_argument('--fromdate', '-f',
                        default='2006-01-01',
                        help='Starting date in YYYY-MM-DD format')

    parser.add_argument('--todate', '-t',
                        default='2006-12-31',
                        help='Starting date in YYYY-MM-DD format')

    parser.add_argument('--stdstats', '-st', action='store_true',
                        help='Show standard observers')

    parser.add_argument('--smasubplot', '-ss', action='store_true',
                        help='Put SMA on own subplot/axis')

    parser.add_argument('--nomacdplot', '-nm', action='store_true',
                        help='Hide the indicator from the plot')

    group = parser.add_mutually_exclusive_group(required=False)

    group.add_argument('--rsioverstoc', '-ros', action='store_true',
                       help='Plot the RSI indicator on the Stochastic axis')

    group.add_argument('--rsioversma', '-rom', action='store_true',
                       help='Plot the RSI indicator on the SMA axis')

    group.add_argument('--stocrsi', '-strsi', action='store_true',
                       help='Plot the Stochastic indicator on the RSI axis')

    parser.add_argument('--stocrsilabels', action='store_true',
                        help='Plot line names instead of indicator name')

    parser.add_argument('--numfigs', '-n', default=1,
                        help='Plot using numfigs figures')

    return parser.parse_args()


if __name__ == '__main__':
    runstrategy()