Data Synchronization Rework
In the latest release the minor number has been moved from 8 to 9 to indicate a change which may have some behavioral impact, regardless, even if compatibility has been taken into account.
With release 1.9.0.99 the entire mechanism to synchronize multiple datas using datetime has been reworked (for both next and once modes).
Note
All standard test cases get a nice OK from nosetests, but complex
uses cases might uncover corner cases not covered.
The previous behavior was discussed in tickets #39, #76, #115 and #129 and this has been the basis to deprecate the old behavior.
Now, the datetime timestamp of the incoming prices is checked to align datas and deliver what’s new (older bars first). Benefits:
-
Non time aligned data can now be used.
-
In live feeds the behavior improves because the re-synchronizes automatically
Let’s recall that the old behavior used the 1st data introduced in the system as a master for time synchronization and no other data could be faster. The order of introduction of datas in the system plays no role now.
Part of the rework has addressed plotting which naively assumed all datas ended up having the same length, being this a consequence of having a time master. The new plotting code allows datas of different length.
Note
The old behavior is still available by using:
cerebro = bt.Cerebro(oldsync=True)
or:
cerebro.run(oldsync=True)
Seeing it with a sample
The multidata-strategy sample has been used as the basis for the
multidata-strategy-unaligned sample (in the same folder). Two data samples
have been manually altered to remove some bars. Both had 756 bars and have
been capped down to 753 at two different points in time
-
End of 2004, beginning of 2005 for
YHOO -
End of 2005 for
ORCL
As always, a execution is worth a thousand words.
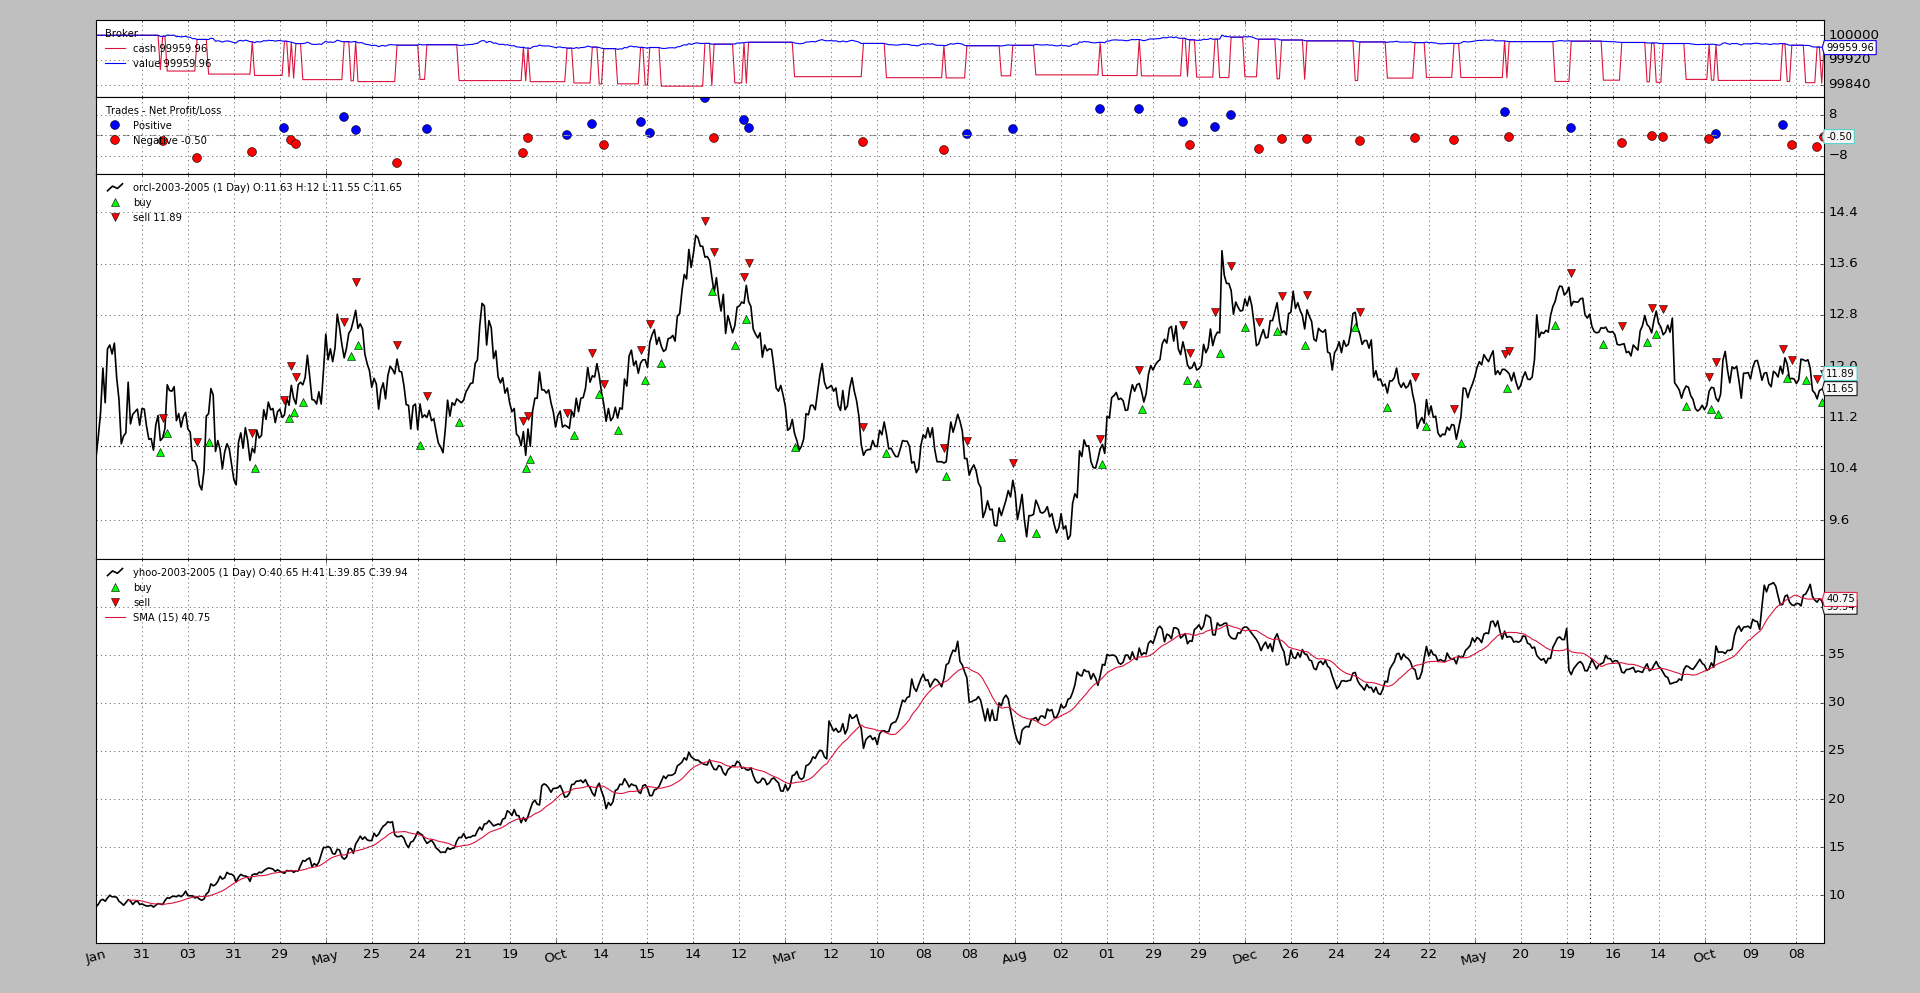
First the old behavior
The execution:
$ ./multidata-strategy-unaligned.py --oldsync --plot
From the output, the important part is right at the end:
...
Self  len: 753
Data0 len: 753
Data1 len: 750
Data0 len == Data1 len: False
Data0 dt: 2005-12-27 23:59:59
Data1 dt: 2005-12-27 23:59:59
...
To notice:
-
The strategy has a length of
753 -
The 1st data (time master) also has
753 -
The 2nd data (time slave) has
750
It’s not obvious from the output but the YHOO file contains data up to
2005-12-30, which is not being processed by the system.
The visual chart
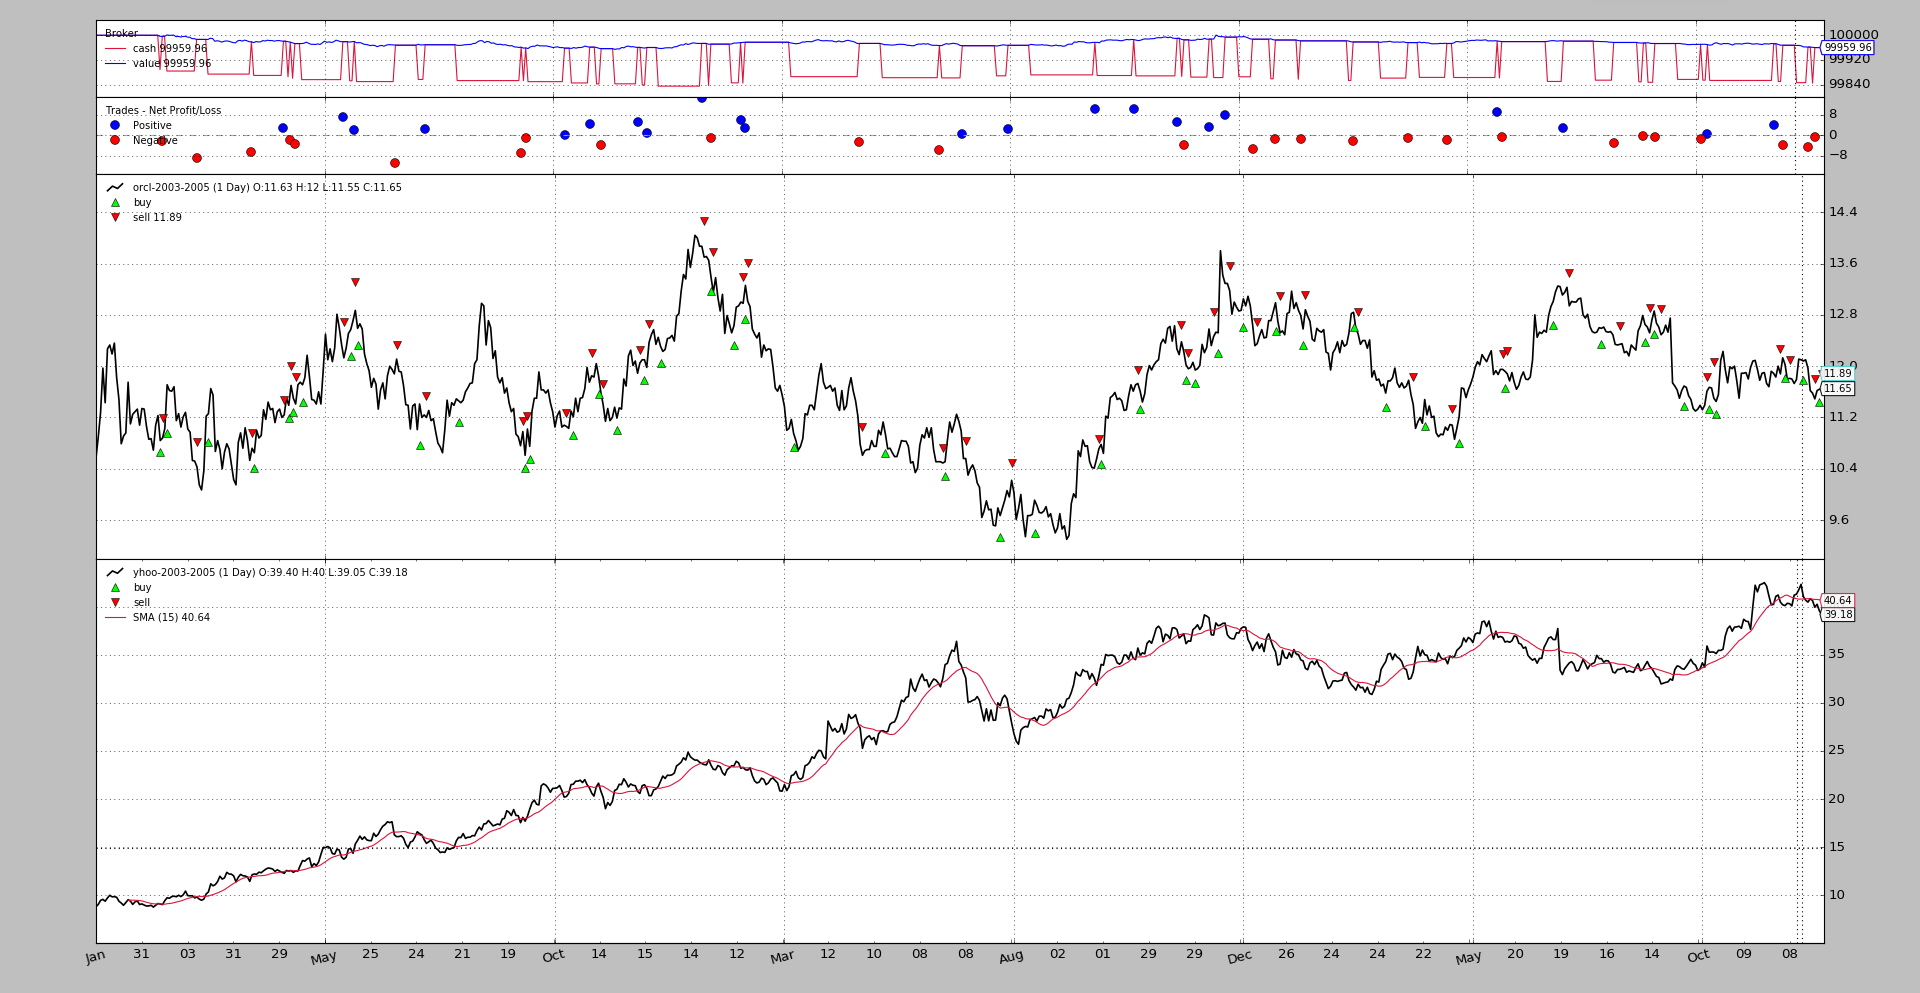
The new behavior
The execution:
$ ./multidata-strategy-unaligned.py --plot
From the output, the important part is right at the end:
...
Self  len: 756
Data0 len: 753
Data1 len: 753
Data0 len == Data1 len: True
Data0 dt: 2005-12-27 23:59:59
Data1 dt: 2005-12-30 23:59:59
...
The behavior has obvioulsy improved:
-
The strategy goes to a length of
756and each of the datas to the full753data points. -
Because the removed data points don’t overlap the strategy ends up being
3units longer than the datas. -
2005-12-30has been reached withdata1(it’s one of the data points removed fordata0), so all datas have been processed to the very end
The visual chart
Although the charts do not exhibit major differences, they are actually different behind the scenes.
Another check
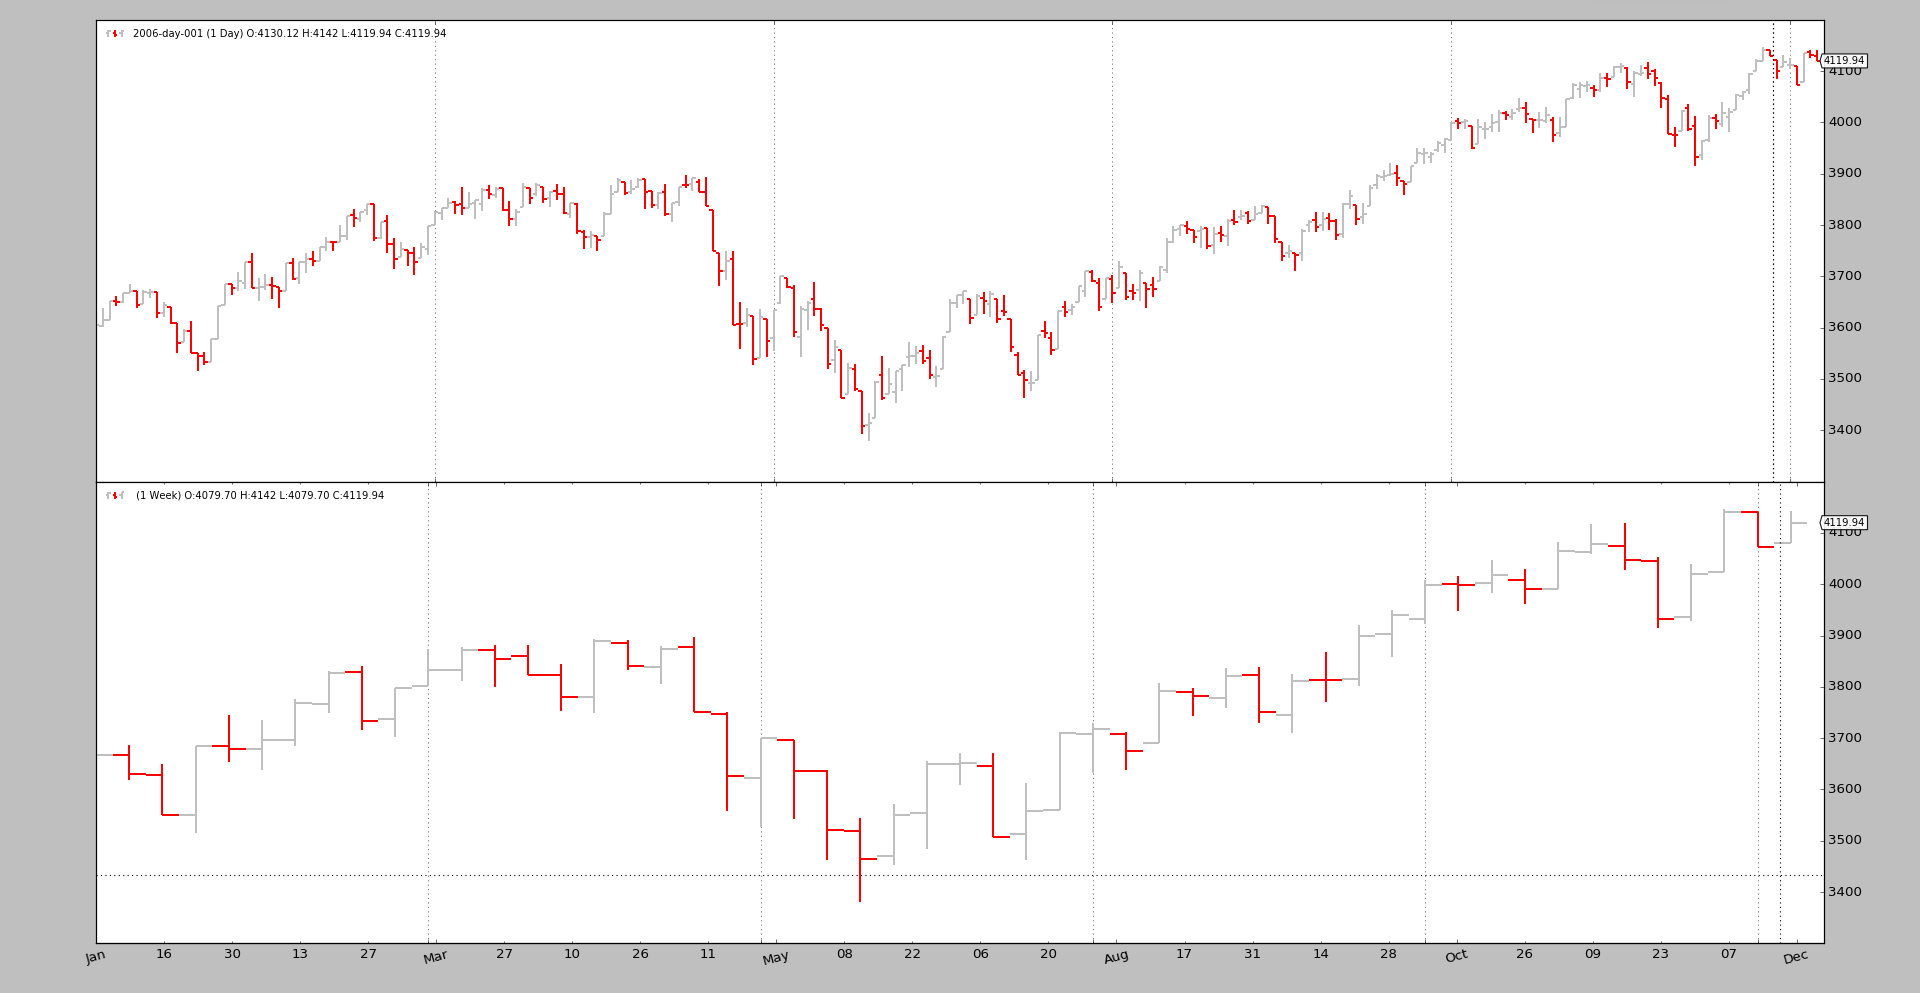
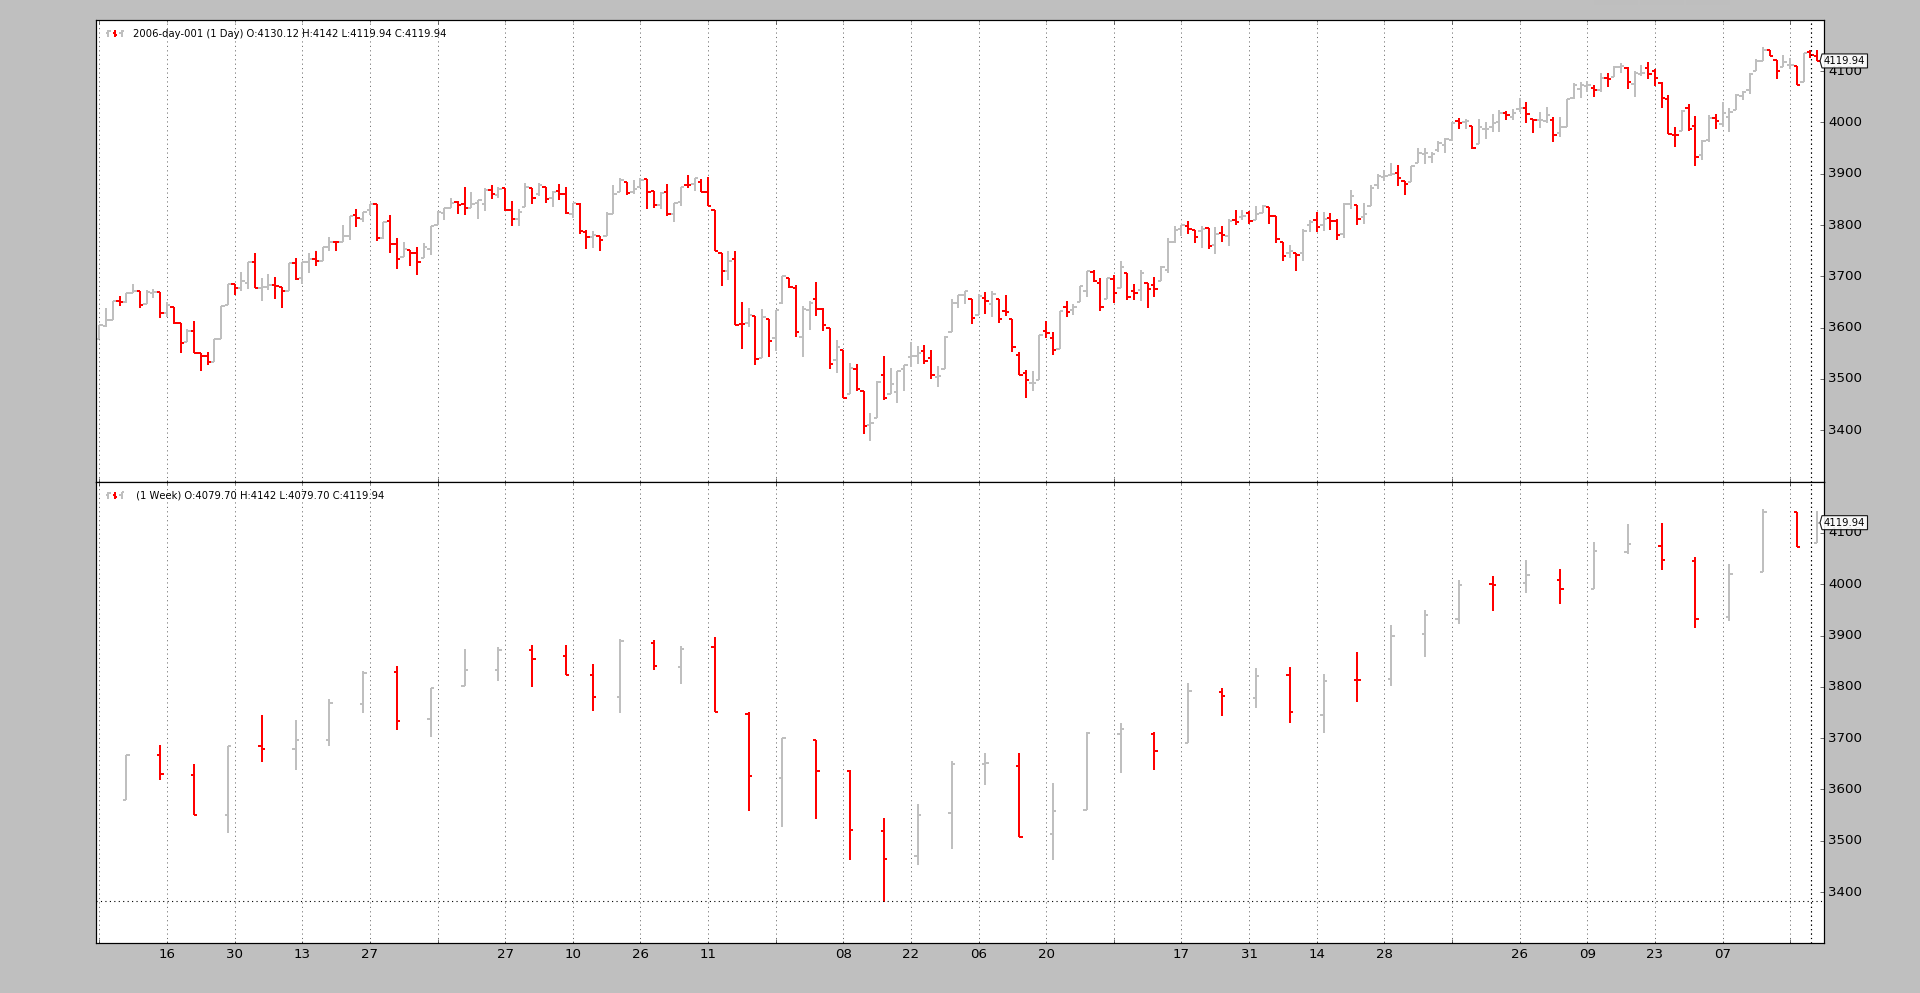
For the interested user, the data-multitimeframe sample has been updated to
also support a --oldsync parameter. Because now different length datas are
being plotted, the visual aspect of the larger time frame is better.
Execution with new synchronization model
Execution with old synchronization model
Sample Usage
$ ./multidata-strategy-unaligned.py --help
usage: multidata-strategy-unaligned.py [-h] [--data0 DATA0] [--data1 DATA1]
                                       [--fromdate FROMDATE] [--todate TODATE]
                                       [--period PERIOD] [--cash CASH]
                                       [--runnext] [--nopreload] [--oldsync]
                                       [--commperc COMMPERC] [--stake STAKE]
                                       [--plot] [--numfigs NUMFIGS]

MultiData Strategy

optional arguments:
  -h, --help            show this help message and exit
  --data0 DATA0, -d0 DATA0
                        1st data into the system
  --data1 DATA1, -d1 DATA1
                        2nd data into the system
  --fromdate FROMDATE, -f FROMDATE
                        Starting date in YYYY-MM-DD format
  --todate TODATE, -t TODATE
                        Starting date in YYYY-MM-DD format
  --period PERIOD       Period to apply to the Simple Moving Average
  --cash CASH           Starting Cash
  --runnext             Use next by next instead of runonce
  --nopreload           Do not preload the data
  --oldsync             Use old data synchronization method
  --commperc COMMPERC   Percentage commission (0.005 is 0.5%
  --stake STAKE         Stake to apply in each operation
  --plot, -p            Plot the read data
  --numfigs NUMFIGS, -n NUMFIGS
                        Plot using numfigs figures
Sample Code
from __future__ import (absolute_import, division, print_function,
                        unicode_literals)

import argparse
import datetime

# The above could be sent to an independent module
import backtrader as bt
import backtrader.feeds as btfeeds
import backtrader.indicators as btind


class MultiDataStrategy(bt.Strategy):
    '''
    This strategy operates on 2 datas. The expectation is that the 2 datas are
    correlated and the 2nd data is used to generate signals on the 1st

      - Buy/Sell Operationss will be executed on the 1st data
      - The signals are generated using a Simple Moving Average on the 2nd data
        when the close price crosses upwwards/downwards

    The strategy is a long-only strategy
    '''
    params = dict(
        period=15,
        stake=10,
        printout=True,
    )

    def log(self, txt, dt=None):
        if self.p.printout:
            dt = dt or self.data.datetime[0]
            dt = bt.num2date(dt)
            print('%s, %s' % (dt.isoformat(), txt))

    def notify_order(self, order):
        if order.status in [bt.Order.Submitted, bt.Order.Accepted]:
            return  # Await further notifications

        if order.status == order.Completed:
            if order.isbuy():
                buytxt = 'BUY COMPLETE, %.2f' % order.executed.price
                self.log(buytxt, order.executed.dt)
            else:
                selltxt = 'SELL COMPLETE, %.2f' % order.executed.price
                self.log(selltxt, order.executed.dt)

        elif order.status in [order.Expired, order.Canceled, order.Margin]:
            self.log('%s ,' % order.Status[order.status])
            pass  # Simply log

        # Allow new orders
        self.orderid = None

    def __init__(self):
        # To control operation entries
        self.orderid = None

        # Create SMA on 2nd data
        sma = btind.MovAv.SMA(self.data1, period=self.p.period)
        # Create a CrossOver Signal from close an moving average
        self.signal = btind.CrossOver(self.data1.close, sma)

    def next(self):
        if self.orderid:
            return  # if an order is active, no new orders are allowed

        if self.p.printout:
            print('Self  len:', len(self))
            print('Data0 len:', len(self.data0))
            print('Data1 len:', len(self.data1))
            print('Data0 len == Data1 len:',
                  len(self.data0) == len(self.data1))

            print('Data0 dt:', self.data0.datetime.datetime())
            print('Data1 dt:', self.data1.datetime.datetime())

        if not self.position:  # not yet in market
            if self.signal > 0.0:  # cross upwards
                self.log('BUY CREATE , %.2f' % self.data1.close[0])
                self.buy(size=self.p.stake)

        else:  # in the market
            if self.signal < 0.0:  # crosss downwards
                self.log('SELL CREATE , %.2f' % self.data1.close[0])
                self.sell(size=self.p.stake)

    def stop(self):
        print('==================================================')
        print('Starting Value - %.2f' % self.broker.startingcash)
        print('Ending   Value - %.2f' % self.broker.getvalue())
        print('==================================================')


def runstrategy():
    args = parse_args()

    # Create a cerebro
    cerebro = bt.Cerebro()

    # Get the dates from the args
    fromdate = datetime.datetime.strptime(args.fromdate, '%Y-%m-%d')
    todate = datetime.datetime.strptime(args.todate, '%Y-%m-%d')

    # Create the 1st data
    data0 = btfeeds.YahooFinanceCSVData(
        dataname=args.data0,
        fromdate=fromdate,
        todate=todate)

    # Add the 1st data to cerebro
    cerebro.adddata(data0)

    # Create the 2nd data
    data1 = btfeeds.YahooFinanceCSVData(
        dataname=args.data1,
        fromdate=fromdate,
        todate=todate)

    # Add the 2nd data to cerebro
    cerebro.adddata(data1)

    # Add the strategy
    cerebro.addstrategy(MultiDataStrategy,
                        period=args.period,
                        stake=args.stake)

    # Add the commission - only stocks like a for each operation
    cerebro.broker.setcash(args.cash)

    # Add the commission - only stocks like a for each operation
    cerebro.broker.setcommission(commission=args.commperc)

    # And run it
    cerebro.run(runonce=not args.runnext,
                preload=not args.nopreload,
                oldsync=args.oldsync)

    # Plot if requested
    if args.plot:
        cerebro.plot(numfigs=args.numfigs, volume=False, zdown=False)


def parse_args():
    parser = argparse.ArgumentParser(description='MultiData Strategy')

    parser.add_argument('--data0', '-d0',
                        default='../../datas/orcl-2003-2005.txt',
                        help='1st data into the system')

    parser.add_argument('--data1', '-d1',
                        default='../../datas/yhoo-2003-2005.txt',
                        help='2nd data into the system')

    parser.add_argument('--fromdate', '-f',
                        default='2003-01-01',
                        help='Starting date in YYYY-MM-DD format')

    parser.add_argument('--todate', '-t',
                        default='2005-12-31',
                        help='Starting date in YYYY-MM-DD format')

    parser.add_argument('--period', default=15, type=int,
                        help='Period to apply to the Simple Moving Average')

    parser.add_argument('--cash', default=100000, type=int,
                        help='Starting Cash')

    parser.add_argument('--runnext', action='store_true',
                        help='Use next by next instead of runonce')

    parser.add_argument('--nopreload', action='store_true',
                        help='Do not preload the data')

    parser.add_argument('--oldsync', action='store_true',
                        help='Use old data synchronization method')

    parser.add_argument('--commperc', default=0.005, type=float,
                        help='Percentage commission (0.005 is 0.5%%')

    parser.add_argument('--stake', default=10, type=int,
                        help='Stake to apply in each operation')

    parser.add_argument('--plot', '-p', action='store_true',
                        help='Plot the read data')

    parser.add_argument('--numfigs', '-n', default=1,
                        help='Plot using numfigs figures')

    return parser.parse_args()


if __name__ == '__main__':
    runstrategy()


