Gold vs SP500
Sometimes getting hints about where backtrader is in use helps understanding what people may be looking for and using the platform for.
The reference:
It is a post (Spanish) analyzing two ETFs: GLD vs SPY (effectively
Gold vs S&P500)
Without going into the translation, let’s concentrate on the important points for backtrader:
-
Adding a Correlation indicator. For the sake of it
PearsonRwas chosen.And for the feat of creating it and instead of coding it from scratch, a sample of how to do it from a
scipyfunction is done. The codeclass PearsonR(bt.ind.PeriodN): _mindatas = 2 # hint to the platform lines = ('correlation',) params = (('period', 20),) def next(self): c, p, = scipy.stats.pearsonr(self.data0.get(size=self.p.period), self.data1.get(size=self.p.period)) self.lines.correlation[0] = c -
Adding rolling logarithmic returns
The platform already had an analyzer with logarithmic returns, but not rolling.
The analyzer
LogReturnsRollinghas been added, which takes atimeframeparameter (andcompression) to use a different timeframe than that of the data (if needed be)And together with it and for visualization (using the analyzer internally) a
LogReturnsobserver -
Allowing data on data plotting (easily). Just like this
# Data feeds data0 = YahooData(dataname=args.data0, **kwargs) # cerebro.adddata(data0) cerebro.resampledata(data0, timeframe=bt.TimeFrame.Weeks) data1 = YahooData(dataname=args.data1, **kwargs) # cerebro.adddata(data1) cerebro.resampledata(data1, timeframe=bt.TimeFrame.Weeks) data1.plotinfo.plotmaster = data0Just using
plotmaster=data0will plotdata1ondata0
Plotting the moving averages on its own axis and on each other was supported from the very start of the platform.
The analyzer and observer have also been added to the platform, together with a sample with the same defaults as those from the blog post.
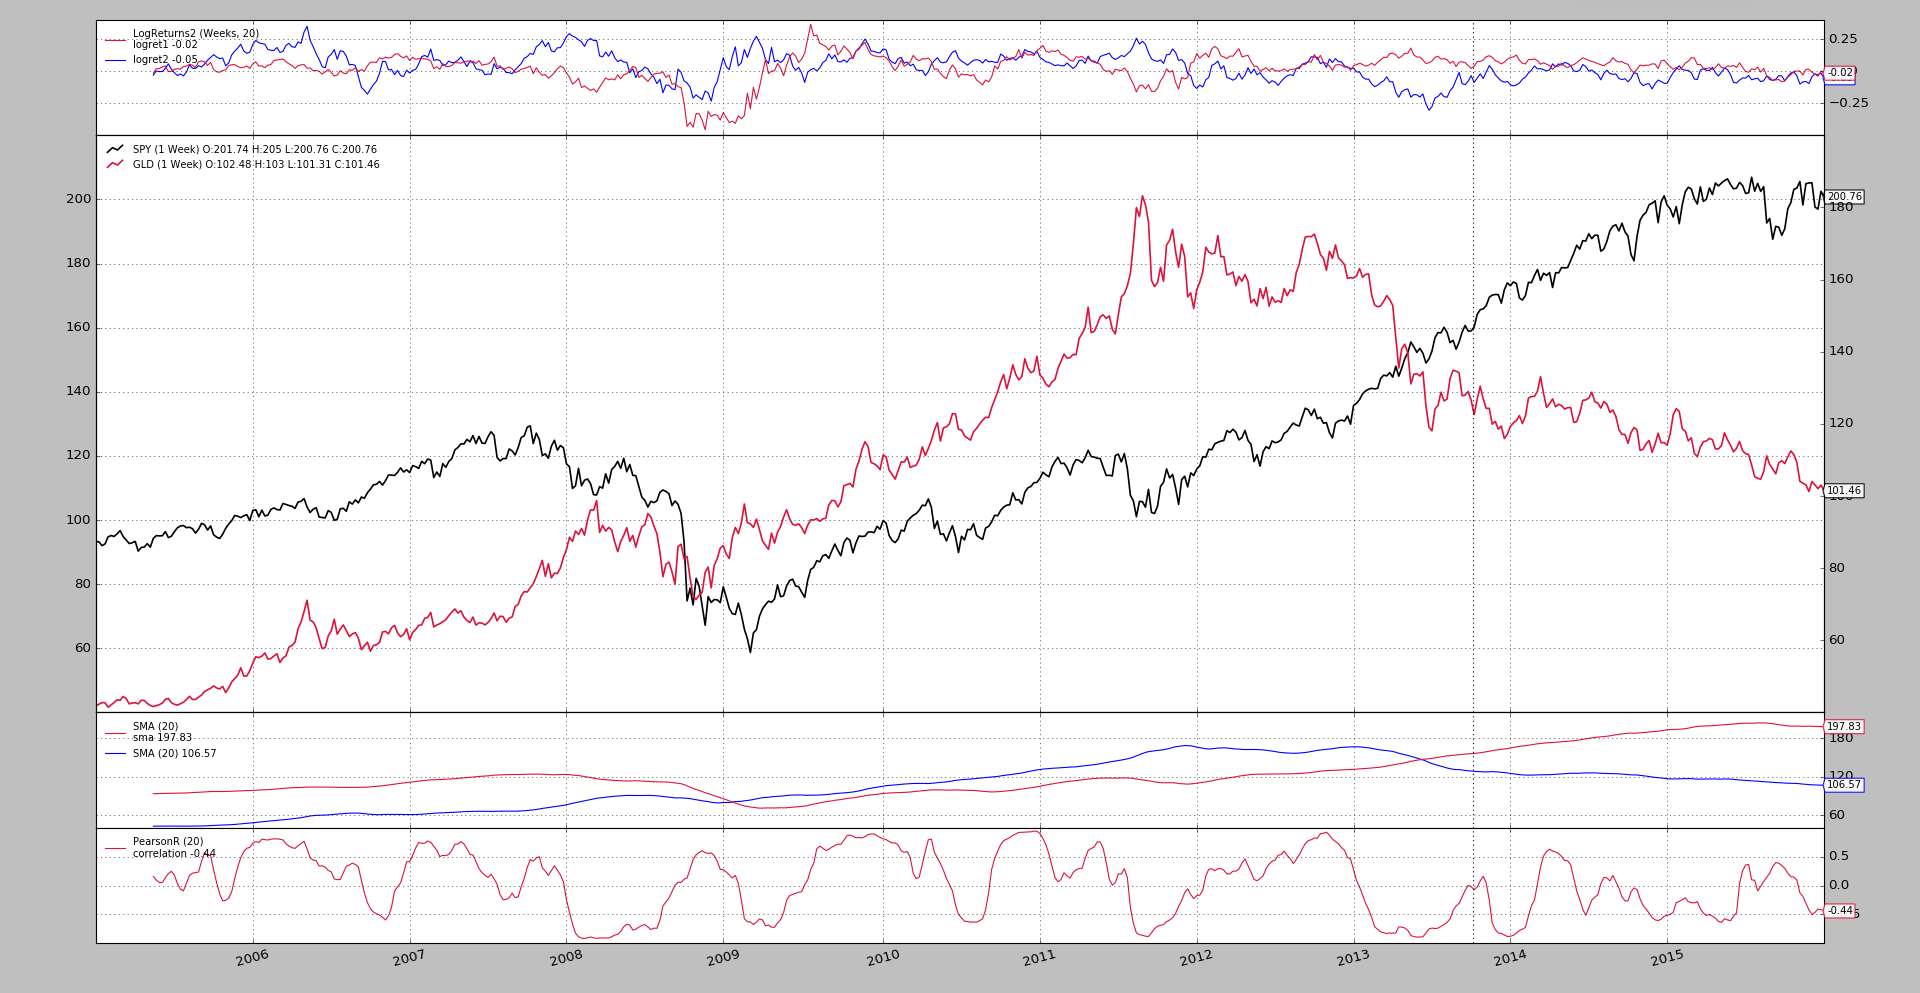
Running the sample:
$ ./gold-vs-sp500.py --cerebro stdstats=False --plot volume=False
Note
stdstats=False and volume=False are there to reduce clutter in the
chart by removing some of the usual things like CashValue observer and
the volume subplots.
Produces a chart which mimics most of the output from the article.
Not included:
-
The charts creating distributions of returns.
They wouldn’t fit in the chart which has a datetime based x axis.
But having those distributions may come.
Sample Usage
$ ./gold-vs-sp500.py --help
usage: gold-vs-sp500.py [-h] [--data0 TICKER] [--data1 TICKER] [--offline]
[--fromdate FROMDATE] [--todate TODATE]
[--cerebro kwargs] [--broker kwargs] [--sizer kwargs]
[--strat kwargs] [--plot [kwargs]] [--myobserver]
Gold vs SP500 from https://estrategiastrading.com/oro-bolsa-estadistica-con-
python/
optional arguments:
-h, --help show this help message and exit
--data0 TICKER Yahoo ticker to download (default: SPY)
--data1 TICKER Yahoo ticker to download (default: GLD)
--offline Use the offline files (default: False)
--fromdate FROMDATE Date[time] in YYYY-MM-DD[THH:MM:SS] format (default:
2005-01-01)
--todate TODATE Date[time] in YYYY-MM-DD[THH:MM:SS] format (default:
2016-01-01)
--cerebro kwargs kwargs in key=value format (default: )
--broker kwargs kwargs in key=value format (default: )
--sizer kwargs kwargs in key=value format (default: )
--strat kwargs kwargs in key=value format (default: )
--plot [kwargs] kwargs in key=value format (default: )
Sample Code
from __future__ import (absolute_import, division, print_function,
unicode_literals)
# Reference
# https://estrategiastrading.com/oro-bolsa-estadistica-con-python/
import argparse
import datetime
import scipy.stats
import backtrader as bt
class PearsonR(bt.ind.PeriodN):
    _mindatas = 2  # hint to the platform

    lines = ('correlation',)
    params = (('period', 20),)

    def next(self):
        c, p, = scipy.stats.pearsonr(self.data0.get(size=self.p.period),
                                     self.data1.get(size=self.p.period))

        self.lines.correlation[0] = c
class MACrossOver(bt.Strategy):
params = (
('ma', bt.ind.MovAv.SMA),
('pd1', 20),
('pd2', 20),
)
def __init__(self):
ma1 = self.p.ma(self.data0, period=self.p.pd1, subplot=True)
self.p.ma(self.data1, period=self.p.pd2, plotmaster=ma1)
PearsonR(self.data0, self.data1)
def runstrat(args=None):
args = parse_args(args)
cerebro = bt.Cerebro()
# Data feed kwargs
kwargs = dict()
# Parse from/to-date
dtfmt, tmfmt = '%Y-%m-%d', 'T%H:%M:%S'
for a, d in ((getattr(args, x), x) for x in ['fromdate', 'todate']):
if a:
strpfmt = dtfmt + tmfmt * ('T' in a)
kwargs[d] = datetime.datetime.strptime(a, strpfmt)
if not args.offline:
YahooData = bt.feeds.YahooFinanceData
else:
YahooData = bt.feeds.YahooFinanceCSVData
    # Data feeds
    data0 = YahooData(dataname=args.data0, **kwargs)
    # cerebro.adddata(data0)
    cerebro.resampledata(data0, timeframe=bt.TimeFrame.Weeks)

    data1 = YahooData(dataname=args.data1, **kwargs)
    # cerebro.adddata(data1)
    cerebro.resampledata(data1, timeframe=bt.TimeFrame.Weeks)
    data1.plotinfo.plotmaster = data0
# Broker
kwargs = eval('dict(' + args.broker + ')')
cerebro.broker = bt.brokers.BackBroker(**kwargs)
# Sizer
kwargs = eval('dict(' + args.sizer + ')')
cerebro.addsizer(bt.sizers.FixedSize, **kwargs)
# Strategy
if True:
kwargs = eval('dict(' + args.strat + ')')
cerebro.addstrategy(MACrossOver, **kwargs)
cerebro.addobserver(bt.observers.LogReturns2,
timeframe=bt.TimeFrame.Weeks,
compression=20)
# Execute
cerebro.run(**(eval('dict(' + args.cerebro + ')')))
if args.plot: # Plot if requested to
cerebro.plot(**(eval('dict(' + args.plot + ')')))
def parse_args(pargs=None):
parser = argparse.ArgumentParser(
formatter_class=argparse.ArgumentDefaultsHelpFormatter,
description=(
'Gold vs SP500 from '
'https://estrategiastrading.com/oro-bolsa-estadistica-con-python/')
)
parser.add_argument('--data0', required=False, default='SPY',
metavar='TICKER', help='Yahoo ticker to download')
parser.add_argument('--data1', required=False, default='GLD',
metavar='TICKER', help='Yahoo ticker to download')
parser.add_argument('--offline', required=False, action='store_true',
help='Use the offline files')
# Defaults for dates
parser.add_argument('--fromdate', required=False, default='2005-01-01',
help='Date[time] in YYYY-MM-DD[THH:MM:SS] format')
parser.add_argument('--todate', required=False, default='2016-01-01',
help='Date[time] in YYYY-MM-DD[THH:MM:SS] format')
parser.add_argument('--cerebro', required=False, default='',
metavar='kwargs', help='kwargs in key=value format')
parser.add_argument('--broker', required=False, default='',
metavar='kwargs', help='kwargs in key=value format')
parser.add_argument('--sizer', required=False, default='',
metavar='kwargs', help='kwargs in key=value format')
parser.add_argument('--strat', required=False, default='',
metavar='kwargs', help='kwargs in key=value format')
parser.add_argument('--plot', required=False, default='',
nargs='?', const='{}',
metavar='kwargs', help='kwargs in key=value format')
return parser.parse_args(pargs)
if __name__ == '__main__':
runstrat()