Note
This post is kept for historical reasons. The indicator and sample have been
updated in the sources and PivotPoint can now auto-couple itself,
removing boilerplate for the user code.
A new post will be written referencing this one. Meanwhile, please check the updated sample in the sources.
Pivot Point and Cross Plotting
An interesting request came across:
- PivotPoint
It is interesting because of how the indicator is defined. Literature can be
found at PivotPoint at StockCharts.
PivotPoints use the close, high and low prices of a past
timeframe. For example for the daily timeframe:
- Pivot Points for daily charts use the prior month’s data
This may seem troublesome because for each timeframe there needs to be a definition of what other timeframe has to be used. Looking at the formulas opens up another question:
Pivot Point (P) = (High + Low + Close)/3
Support 1 (S1) = (P x 2) - High
Support 2 (S2) = P  -  (High  -  Low)
Resistance 1 (R1) = (P x 2) - Low
Resistance 2 (R2) = P + (High  -  Low)
Even if the text is full of references to prior period and past … the formulas seem to reference the current point in time. Let’s follow the advice of the text and use previous in our first attempt at the PivotPoint. But first let’s tackle the problem of the different timeframes by doing this:
- The indicator will not tackle the problem
Although this may seem confusing, one has to take into account that indicators have to remain as stupid as possible and be made up of actual formulas. The problem will be solved as follows:
data = btfeeds.ADataFeed(..., timeframe=bt.TimeFrame.Days)
cerebro.adddata(data)
cerebro.resampledata(data, timeframe=bt.TimeFrame.Months)
And later in the Strategy:
class MyStrategy(bt.Strategy):
    def __init__(self):
        self.pp = PivotPoint(self.data1)  # the resampled data
Now it’s clear. The system will have the data, plus an extra input resampled to
the needed timeframe. And the PivotPoint indicator will work with the
resampled data, which is already in the needed monthly timeframe for the
original data timeframe which is daily.
The indicator can be developed. Let’s start by following the text indications and not the formulas and look back 1 period.
class PivotPoint1(bt.Indicator):
    lines = ('p', 's1', 's2', 'r1', 'r2',)

    def __init__(self):
        h = self.data.high(-1)  # previous high
        l = self.data.low(-1)  # previous low
        c = self.data.close(-1)  # previous close

        self.lines.p = p = (h + l + c) / 3.0

        p2 = p * 2.0
        self.lines.s1 = p2 - h  # (p x 2) - high
        self.lines.r1 = p2 - l  # (p x 2) - low

        hilo = h - l
        self.lines.s2 = p - hilo  # p - (high - low)
        self.lines.r2 = p + hilo  # p + (high - low)
The strategy will look at parameter usepp1 to use this PivotPoint1
    def __init__(self):
        if self.p.usepp1:
            self.pp = PivotPoint1(self.data1)
        else:
            self.pp = PivotPoint(self.data1)
And the output is controlled by a simple next method
    def next(self):
        txt = ','.join(
            ['%04d' % len(self),
             '%04d' % len(self.data0),
             '%04d' % len(self.data1),
             self.data.datetime.date(0).isoformat(),
             '%.2f' % self.pp[0]])

        print(txt)
Let’s execute:
./ppsample --usepp1
And the output:
0041,0041,0002,2005-02-28,2962.79
0042,0042,0002,2005-03-01,2962.79
...
Immediately something is clear: index 41 already belongs to the 2nd month. That means we have skipped calculation of the indicator by 1 month. It is now clear why the text in StockCharts is always mentioning that the calculation happens with the previous month but the formulas seem to reference the current moment.
-
The developers probably faced the same design decisions with multiple datas with multiple timeframes.
At the current daily point, only the closed bar from the previous month can be delivered.
That’s why the next method is looking at index [0]. All this has a very
easy fix and that’s writing the formulas just like StockCharts documents them.
class PivotPoint(bt.Indicator):
    lines = ('p', 's1', 's2', 'r1', 'r2',)
    plotinfo = dict(subplot=False)

    def __init__(self):
        h = self.data.high  # current high
        l = self.data.low  # current high
        c = self.data.close  # current high

        self.lines.p = p = (h + l + c) / 3.0

        p2 = p * 2.0
        self.lines.s1 = p2 - h  # (p x 2) - high
        self.lines.r1 = p2 - l  # (p x 2) - low

        hilo = h - l
        self.lines.s2 = p - hilo  # p - (high - low)
        self.lines.r2 = p + hilo  # p + (high - low)
An execution without usepp1:
./ppsample
And the new output is:
0021,0021,0001,2005-01-31,2962.79
0022,0022,0001,2005-02-01,2962.79
...
Et voilá! The 1st month had 20 trading days and once complete the indicator
has calculated the values and can be delivered. The only printed line is p
and if the value is the same in the 2 lines is because the value remains fixed
for the entire next month. Quoting StockCharts:
Once Pivot Points are set, they do not change and remain in play throughout ...
The indicator can already be used. Let’s go for plotting. A plotting parameter has already been set
plotinfo = dict(subplot=False)
The calculated values are in line with the data scale and just like a Moving
Average it can be plotted along the data (hence subplot=False)
An execution with --plot:
./ppsample --plot
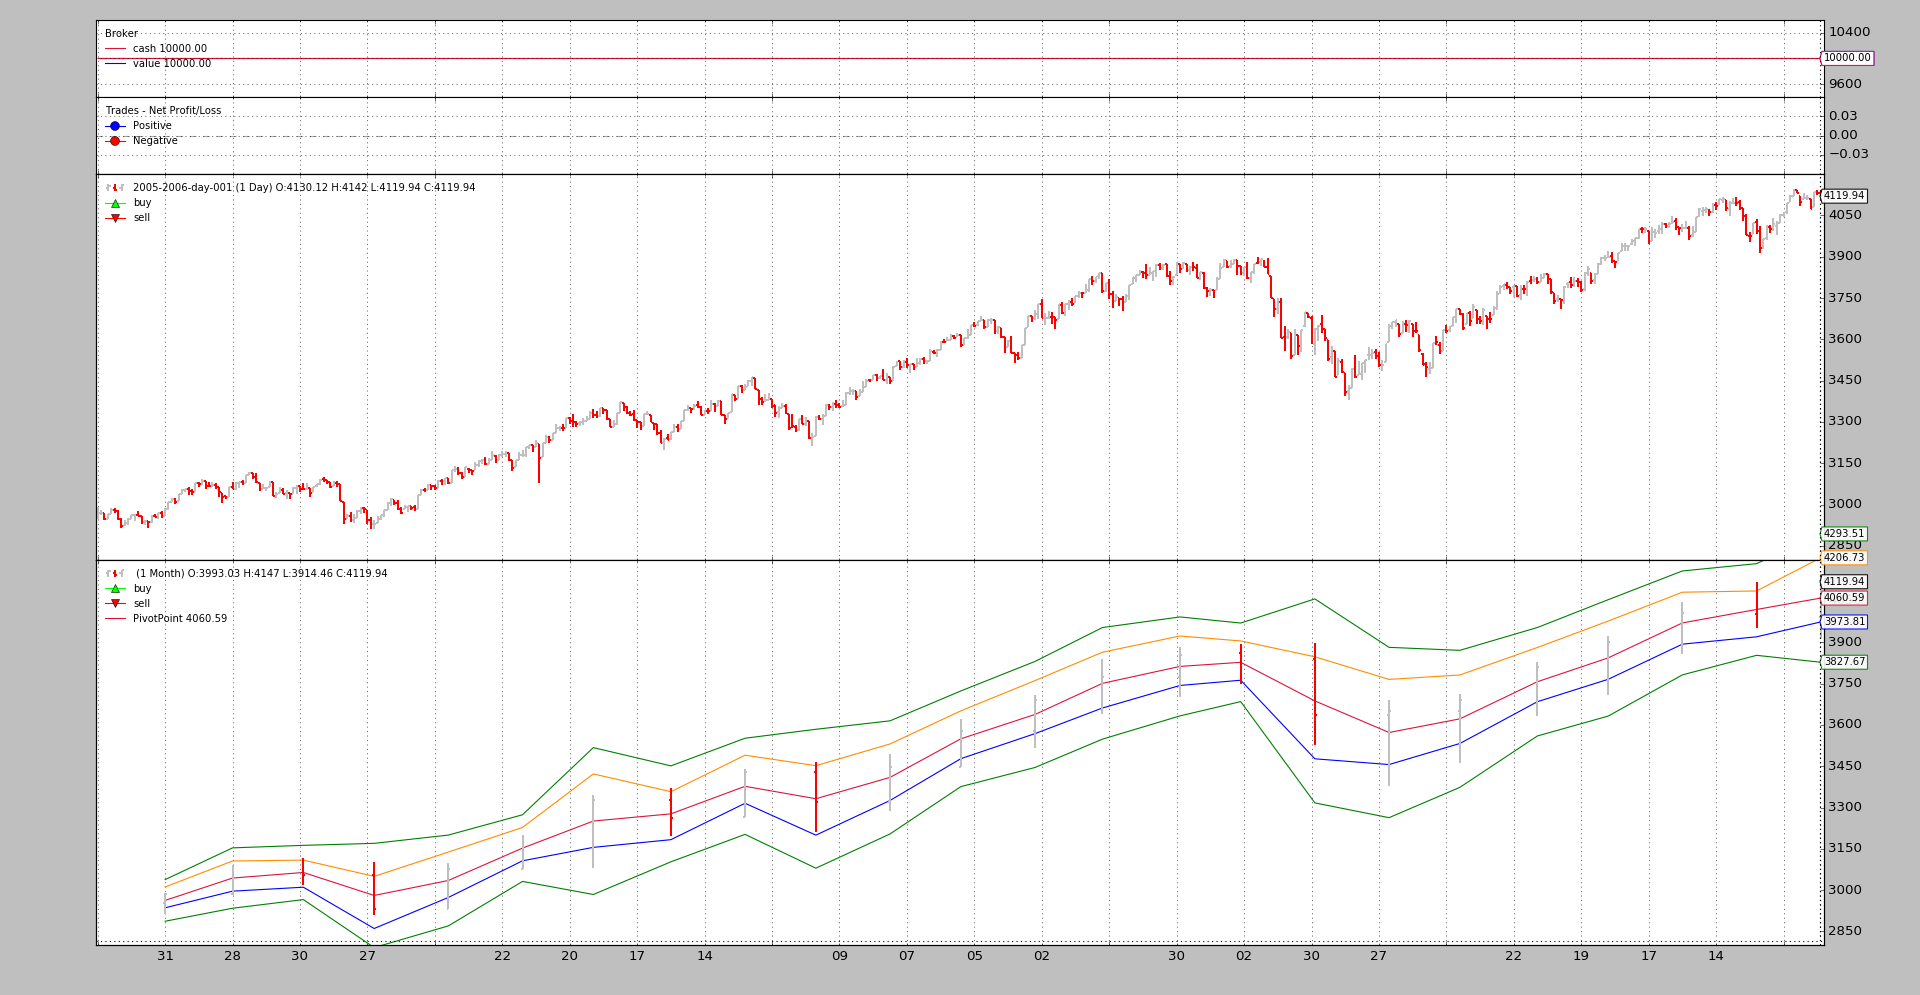
The blistering barnacles are attacking again. The indicator has been plotted on the monthly data (its source), which gives no visual indication on the daily chart, where it would be really helpful.
But backtrader supports cross-plotting from one data to another. Although
a small addition in 1.2.8.88 was needed to support cross-plotting to a data
of a different timeframe.
This is achieved by having plotmaster say which the plot target is, by
adding it to the plotinfo attribute of the indicator:
./ppsample --plot --plot-on-daily
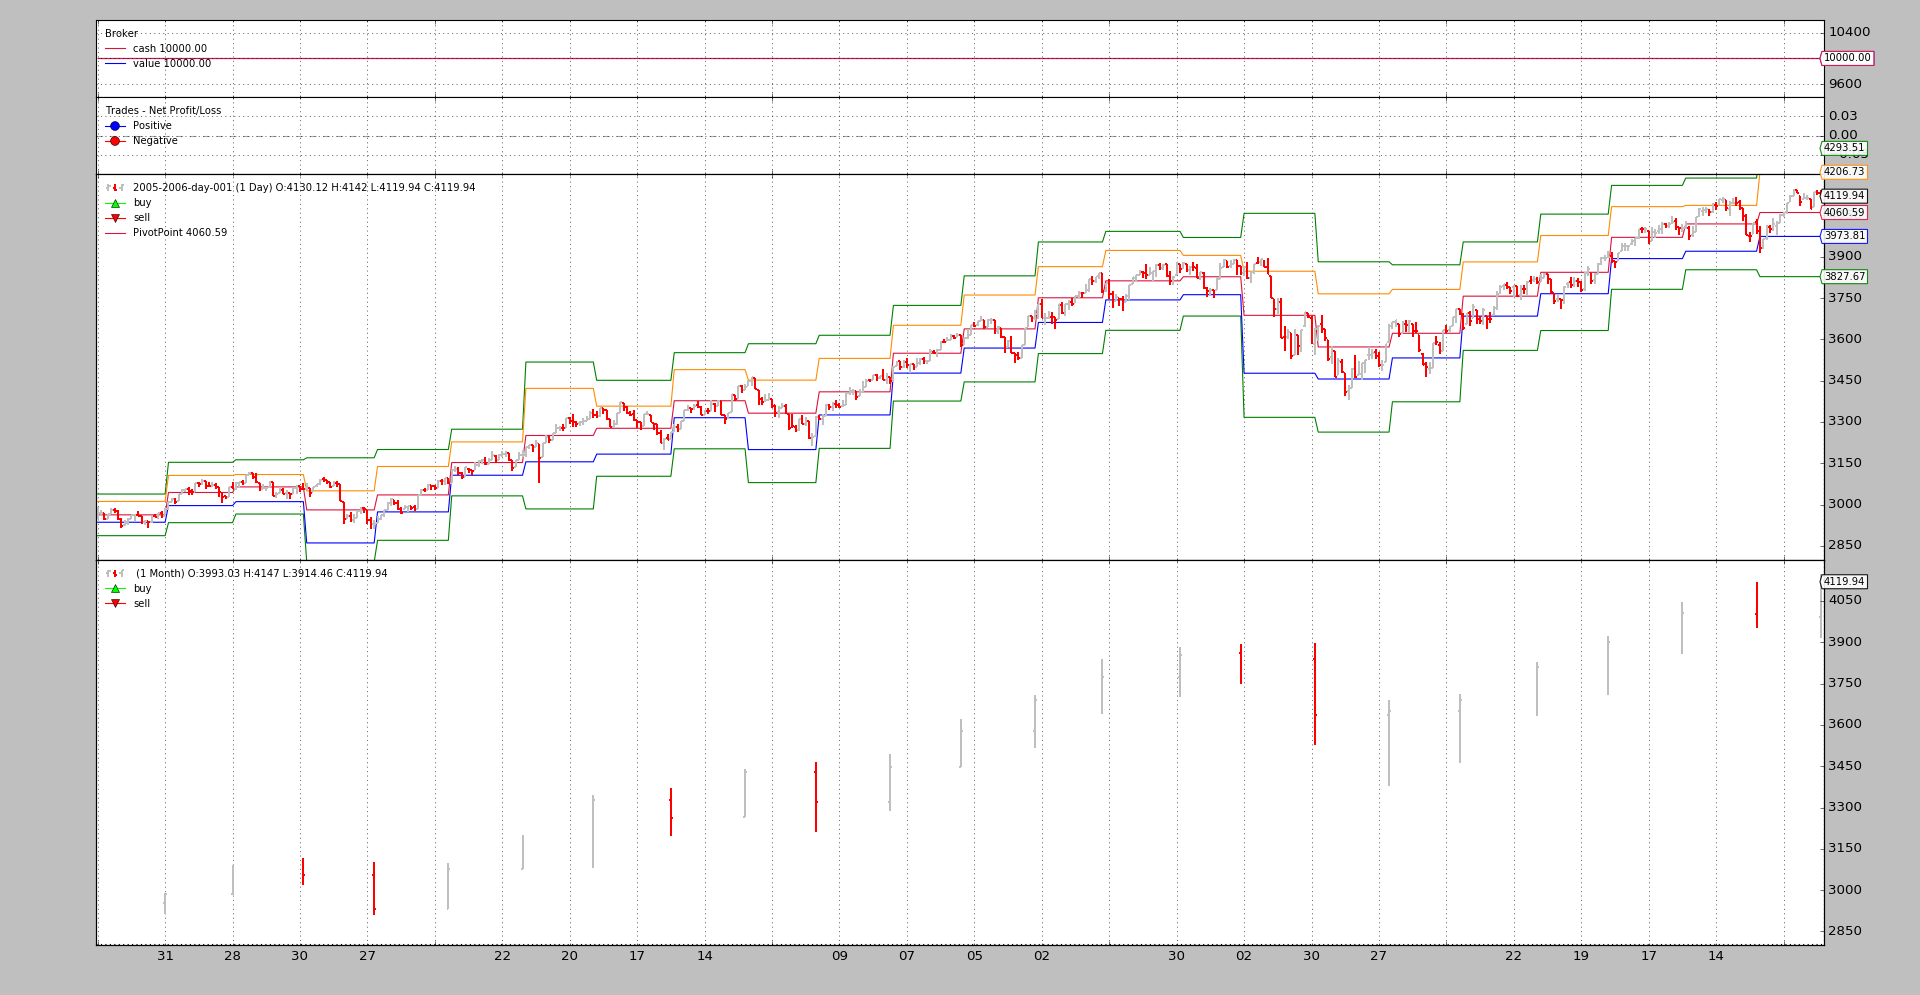
The visual feedback is now useful to understand what PivotPoint is offering.
Script Code and Usage
Available as sample in the sources of backtrader:
$ ./ppsample.py --help
usage: ppsample.py [-h] [--data DATA] [--usepp1] [--plot] [--plot-on-daily]

Sample for pivot point and cross plotting

optional arguments:
  -h, --help       show this help message and exit
  --data DATA      Data to be read in (default:
                   ../../datas/2005-2006-day-001.txt)
  --usepp1         Have PivotPoint look 1 period backwards (default: False)
  --plot           Plot the result (default: False)
  --plot-on-daily  Plot the indicator on the daily data (default: False)
The code for PivotPoint
from __future__ import (absolute_import, division, print_function,)
#                        unicode_literals)

import backtrader as bt


class PivotPoint1(bt.Indicator):
    lines = ('p', 's1', 's2', 'r1', 'r2',)

    def __init__(self):
        h = self.data.high(-1)  # previous high
        l = self.data.low(-1)  # previous low
        c = self.data.close(-1)  # previous close

        self.lines.p = p = (h + l + c) / 3.0

        p2 = p * 2.0
        self.lines.s1 = p2 - h  # (p x 2) - high
        self.lines.r1 = p2 - l  # (p x 2) - low

        hilo = h - l
        self.lines.s2 = p - hilo  # p - (high - low)
        self.lines.r2 = p + hilo  # p + (high - low)


class PivotPoint(bt.Indicator):
    lines = ('p', 's1', 's2', 'r1', 'r2',)
    plotinfo = dict(subplot=False)

    def __init__(self):
        h = self.data.high  # current high
        l = self.data.low  # current high
        c = self.data.close  # current high

        self.lines.p = p = (h + l + c) / 3.0

        p2 = p * 2.0
        self.lines.s1 = p2 - h  # (p x 2) - high
        self.lines.r1 = p2 - l  # (p x 2) - low

        hilo = h - l
        self.lines.s2 = p - hilo  # p - (high - low)
        self.lines.r2 = p + hilo  # p + (high - low)
The code for the script.
from __future__ import (absolute_import, division, print_function,
                        unicode_literals)

import argparse

import backtrader as bt
import backtrader.feeds as btfeeds
import backtrader.utils.flushfile

from pivotpoint import PivotPoint, PivotPoint1


class St(bt.Strategy):
    params = (('usepp1', False),
              ('plot_on_daily', False))

    def __init__(self):
        if self.p.usepp1:
            self.pp = PivotPoint1(self.data1)
        else:
            self.pp = PivotPoint(self.data1)

        if self.p.plot_on_daily:
            self.pp.plotinfo.plotmaster = self.data0

    def next(self):
        txt = ','.join(
            ['%04d' % len(self),
             '%04d' % len(self.data0),
             '%04d' % len(self.data1),
             self.data.datetime.date(0).isoformat(),
             '%.2f' % self.pp[0]])

        print(txt)


def runstrat():
    args = parse_args()

    cerebro = bt.Cerebro()
    data = btfeeds.BacktraderCSVData(dataname=args.data)
    cerebro.adddata(data)
    cerebro.resampledata(data, timeframe=bt.TimeFrame.Months)

    cerebro.addstrategy(St,
                        usepp1=args.usepp1,
                        plot_on_daily=args.plot_on_daily)
    cerebro.run()
    if args.plot:
        cerebro.plot(style='bar')


def parse_args():
    parser = argparse.ArgumentParser(
        formatter_class=argparse.ArgumentDefaultsHelpFormatter,
        description='Sample for pivot point and cross plotting')

    parser.add_argument('--data', required=False,
                        default='../../datas/2005-2006-day-001.txt',
                        help='Data to be read in')

    parser.add_argument('--usepp1', required=False, action='store_true',
                        help='Have PivotPoint look 1 period backwards')

    parser.add_argument('--plot', required=False, action='store_true',
                        help=('Plot the result'))

    parser.add_argument('--plot-on-daily', required=False, action='store_true',
                        help=('Plot the indicator on the daily data'))

    return parser.parse_args()


if __name__ == '__main__':
    runstrat()