Ultimate Oscillator
One of the goals when the development of backtrader was kickstarted was to make it very easy (at least for the author himself) to develop new Indicators to test ideas both mathematically and visually.
Ticket #102 is about adding the UltimateOscillator to the arsenal of backtrader
Note
It will be added in the next release, meanwhile it can be used, using the code below.
The reference as indicated in the ticket:
and also at:
No need to repeat it here.
Quoting from the reference:
BP = Close - Minimum(Low or Prior Close)

TR = Maximum(High or Prior Close)  -  Minimum(Low or Prior Close)

Average7 = (7-period BP Sum) / (7-period TR Sum)
Average14 = (14-period BP Sum) / (14-period TR Sum)
Average28 = (28-period BP Sum) / (28-period TR Sum)

UO = 100 x [(4 x Average7)+(2 x Average14)+Average28]/(4+2+1)
Summary:
-
First subclass from
bt.Indicatorto make sure the entire machinery works:class UltimateOscillator(bt.Indicator): -
It has 1 output line: we’ll name it
uo:lines = ('uo',) -
It has 3 parameters which define 3 periods with default values
7,14and28. To be namedp1,p2andp3:params = (('p1', 7), ('p2', 14), ('p3', 28), ) -
The calculations use some things already built-in backtrader
Minimum(Low or Prior Close): this isTrueLowas defined by Welles Wilder for theRSIindicator. As such theBPor Buying Pressure can be calculated:
bp = self.data.close - TrueLow(self.data)Maximum(Low or Prior Close) - Minimum(Low or Prior Close): this isTrueRangeas defined by Welles Wilder for theRSIindicator (which can be expressed asTrueHigh - TrueLow. The next calculation is therefore as easy as:
tr = TrueRange(self.data)- The rest are pure math operations, using
SumNto add up the latestp1,p2,p3periods ofbpandtr, plus the weighted calculation:
av7 = SumN(bp, period=self.p.p1) / SumN(tr, period=self.p.p1) av14 = SumN(bp, period=self.p.p2) / SumN(tr, period=self.p.p2) av28 = SumN(bp, period=self.p.p3) / SumN(tr, period=self.p.p3) uo = 100.0 * (4.0 * av7 + 2.0 * av14 + av28) / (4.0 + 2.0 + 1.0)- Finally the assignment of the calculation to the defined
uoline:
self.lines.uo = uo
It seems longer than it actually is (the full code, including imports) at the bottom.
Since we want not only the values but also a nice looking plot, like the ones provided by Stockcharts, we’ll be adding 2 extra touches:
-
2 parameters which determine where to place the horizontal lines that delimit the overbought and oversold areas (ala
RSIorStochastic):('upperband', 70.0), ('lowerband', 30.0), -
And plot initialization code to use the parameters. Ticks at
10,50and90like in the Stockcharts plots will be added:def _plotinit(self): baseticks = [10.0, 50.0, 90.0] hlines = [self.p.upperband, self.p.lowerband] self.plotinfo.plotyhlines = hlines self.plotinfo.plotyticks = baseticks + hlines
To test and to further use existing facilities provided by backtrader, the
btrun executable installed along with backtrader will be used.
-
The indicator is stored in a file named
ultimateoscillator.py -
The data used is one of the data samples available in the sources of backtrader
-
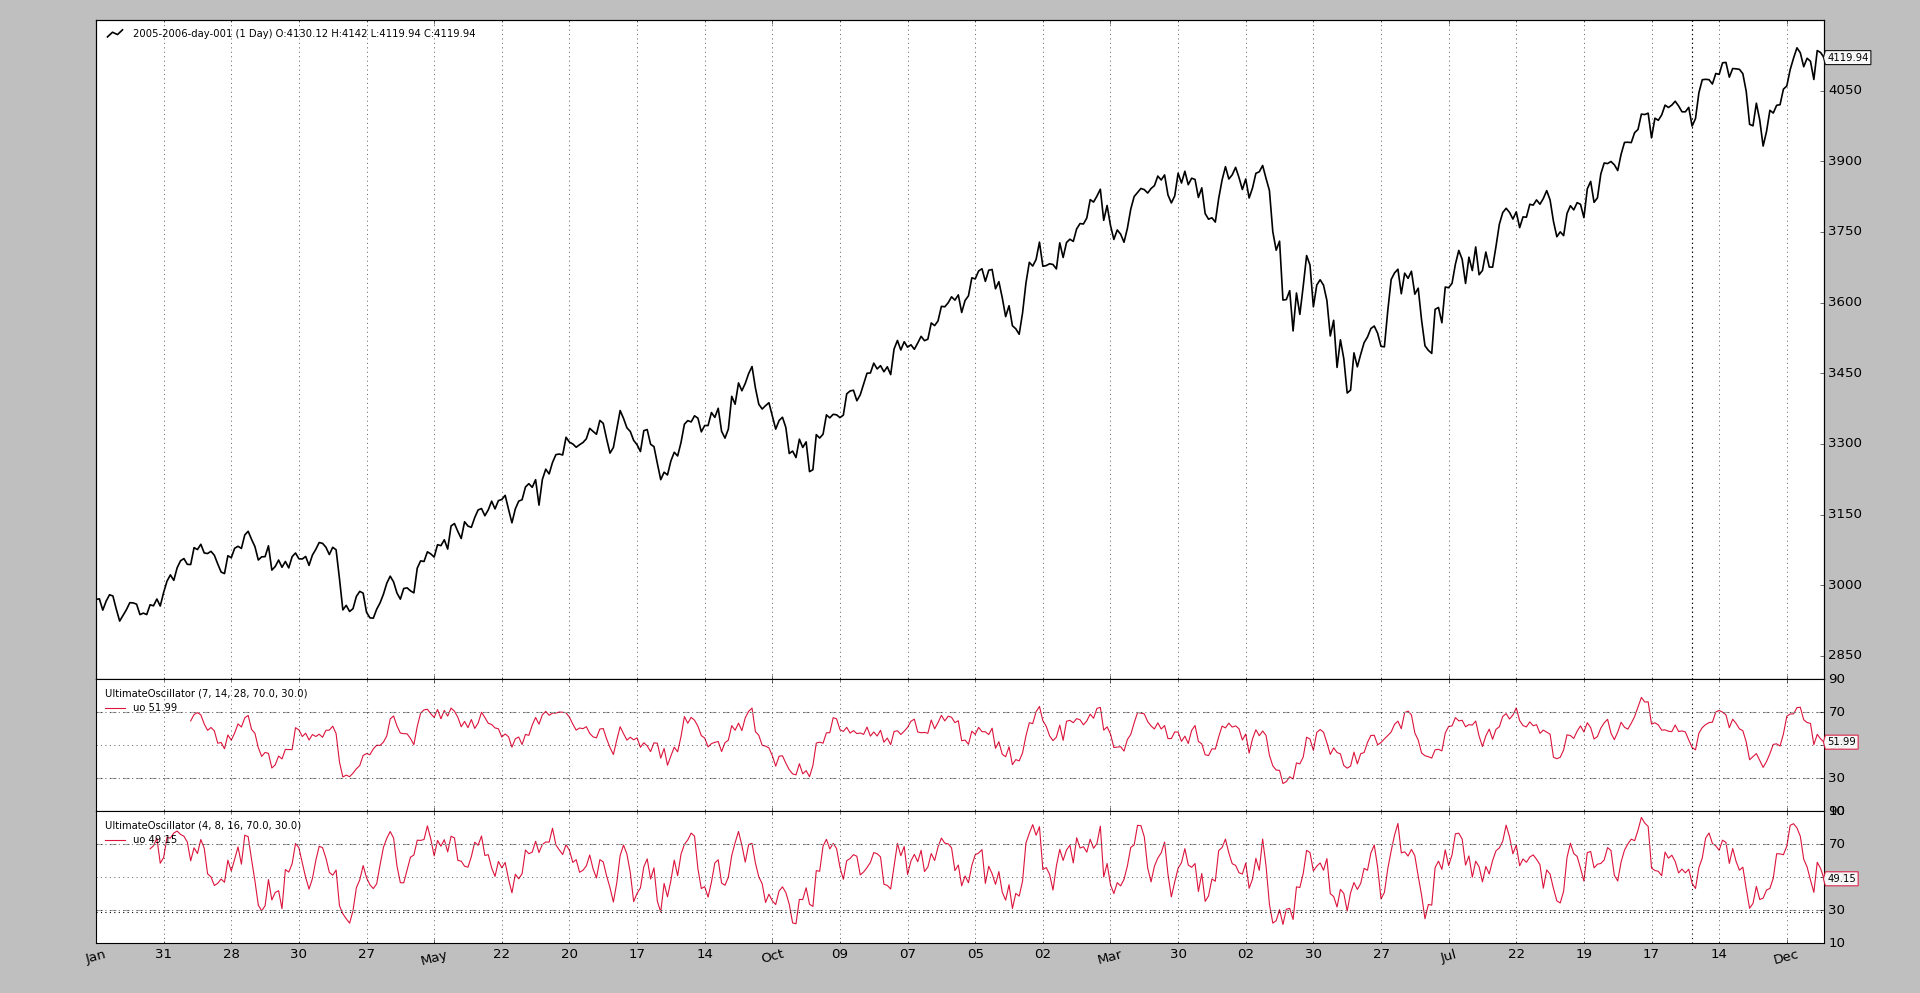
The indicator will be added twice with the default parameters and with shorter term parameters
Execution:
btrun \
--nostdstats \
--data 2005-2006-day-001.txt \
--indicator ultimateoscillator:UltimateOscillator \
--indicator ultimateoscillator:UltimateOscillator:p1=4,p2=8,p3=16 \
--plot
Note
Using –nostdstats to remove some observers from the chart. No need to track cash and value in this case
The output is simply a chart showing the evolution of the
UltimateOscillator.
The UltimateOscillator code:
from __future__ import (absolute_import, division, print_function,
unicode_literals)
import backtrader as bt
from backtrader.indicators import SumN, TrueLow, TrueRange
class UltimateOscillator(bt.Indicator):
'''
Formula:
# Buying Pressure = Close - TrueLow
BP = Close - Minimum(Low or Prior Close)
# TrueRange = TrueHigh - TrueLow
TR = Maximum(High or Prior Close) - Minimum(Low or Prior Close)
Average7 = (7-period BP Sum) / (7-period TR Sum)
Average14 = (14-period BP Sum) / (14-period TR Sum)
Average28 = (28-period BP Sum) / (28-period TR Sum)
UO = 100 x [(4 x Average7)+(2 x Average14)+Average28]/(4+2+1)
See:
- https://en.wikipedia.org/wiki/Ultimate_oscillator
- http://stockcharts.com/school/doku.php?id=chart_school:technical_indicators:ultimate_oscillator
'''
lines = ('uo',)
params = (('p1', 7),
('p2', 14),
('p3', 28),
('upperband', 70.0),
('lowerband', 30.0),
)
def _plotinit(self):
    baseticks = [10.0, 50.0, 90.0]
    hlines = [self.p.upperband, self.p.lowerband]

    self.plotinfo.plotyhlines = hlines
    self.plotinfo.plotyticks = baseticks + hlines
def __init__(self):
bp = self.data.close - TrueLow(self.data)
tr = TrueRange(self.data)
av7 = SumN(bp, period=self.p.p1) / SumN(tr, period=self.p.p1)
av14 = SumN(bp, period=self.p.p2) / SumN(tr, period=self.p.p2)
av28 = SumN(bp, period=self.p.p3) / SumN(tr, period=self.p.p3)
uo = 100.0 * (4.0 * av7 + 2.0 * av14 + av28) / (4.0 + 2.0 + 1.0)
self.lines.uo = uo