Real World Usage
Finally it seems it pays having gotten down to developing backtrader.
Following what seemed like the end of the world when looking at the European markets in the last weeks, a friend asked if I could have a look at the data in our charting package to see how the falling range compared against previous similar occurrences.
Of course I could, but I said I could do more than looking into the charts, because I could quickly:
-
Create a quick
LegDownindicator to measure the range of the fall. It could also have gotten the name ofHighLowRangeorHiLoRange. Luckily and in case this would be deemed needed, it can be solved viaalias -
Create a
LegDownAnalyzerthat would gather the results and sort them
This led to an addtional request:
-
Recovery after the falls in the next 5, 10, 15, 20 days (trading …)
Solved with a
LegUpindicator which writes the values back for alignment with the corresponding``LegDown``
The work was quickly done (within the allowance of my free time) and results shared with the requester. But … being the only problem tha I saw potential for:
-
Improvements in the automation
bt-run.py-
Multiple strategies/observers/analyzers with separated kwargs
-
Injection of indicators directly into Strategies with kwargs for each indicator
-
single plot argument accepting also kwargs
-
-
Improvements in in the
AnalyzerAPI to have automated printing capabilities for the results (which are returned as adict-like instance) and have directdataaccess aliases
Notwithstanding that:
-
An obscure bug showed up due to the implementation combination I wrote to align the
LegDownandLegUpvalues by mixing declaration of and the additional use ofnextThe bug had been introduced to simplify the passing of a single data with multiple
Lines, so thatIndicatorscan operate on each of the lines as individual datas
The latter pushing me into:
-
Adding a background object opposite to
LineDelayto “look” into the “future”That actually means that actual values are written into past array positions
Once all of the above were in place, it was time to retest how nicely the (small?) challenges posed by the above request could be solved more easily and faster (in implementation time).
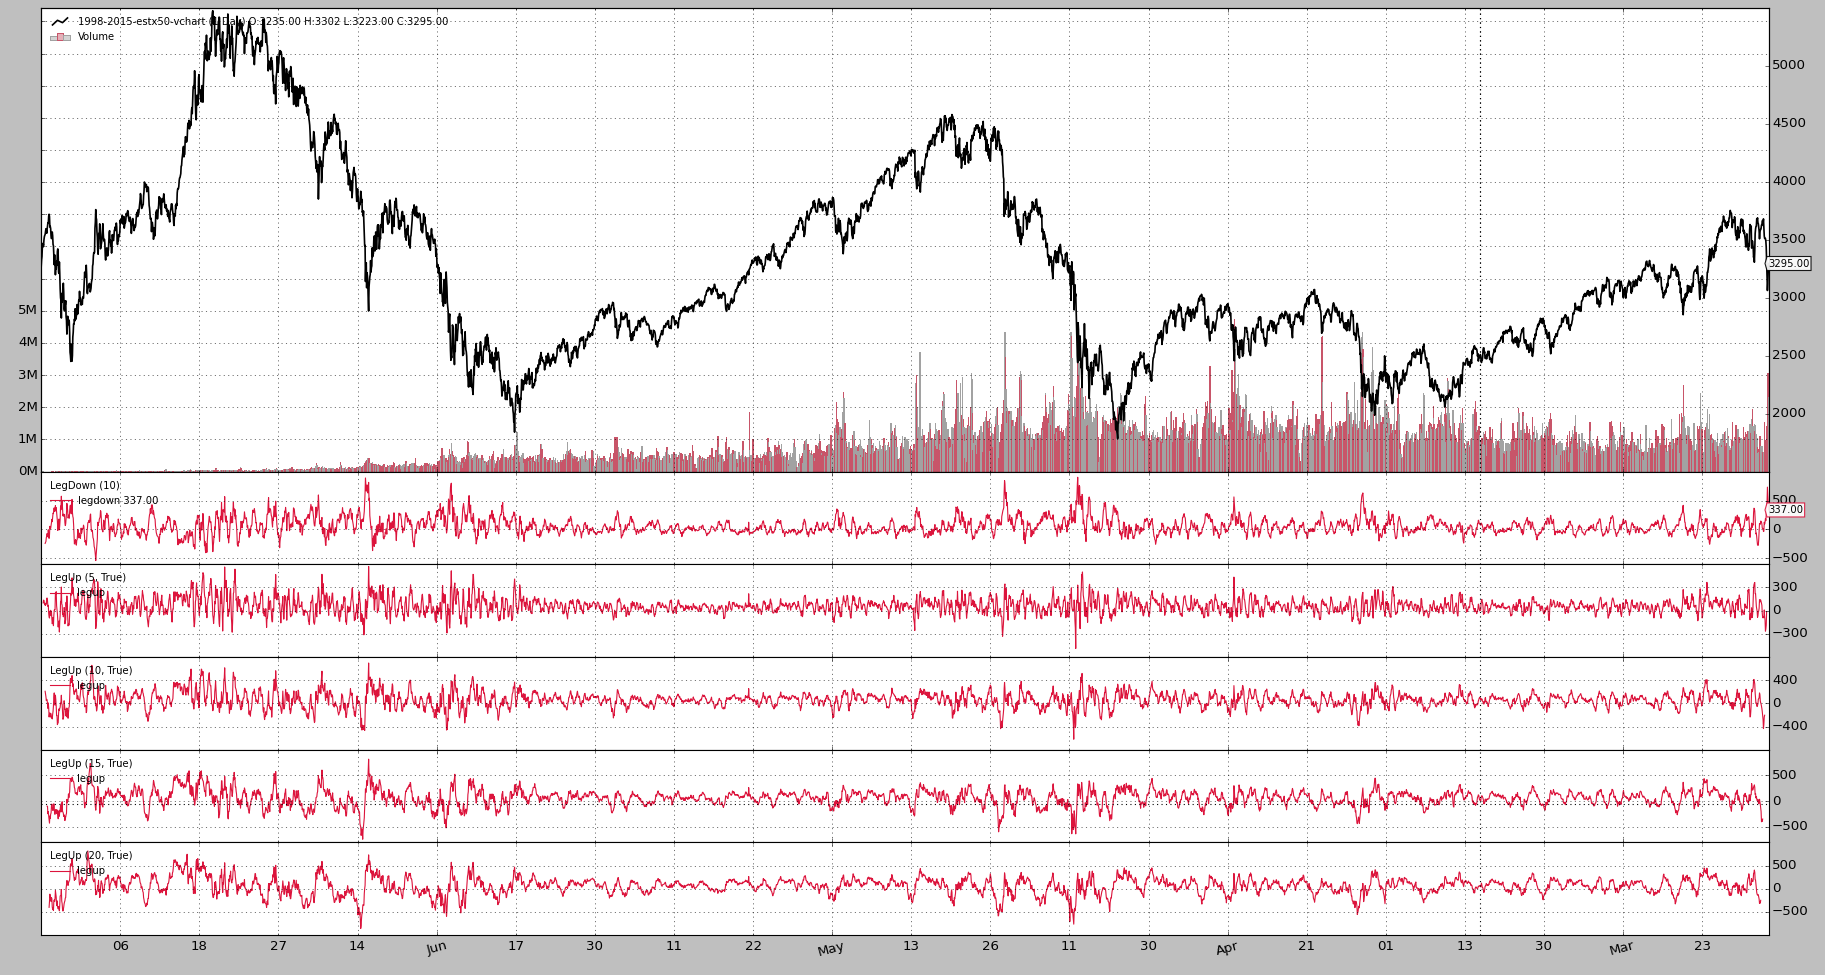
Finally the execution and outcomes for the Eurostoxx 50 Future from 1998 up until today:
bt-run.py \
    --csvformat vchartcsv \
    --data ../datas/sample/1998-2015-estx50-vchart.txt \
    --analyzer legdownup \
    --pranalyzer \
    --nostdstats \
    --plot

====================
== Analyzers
====================
##########
legdownupanalyzer
##########
Date,LegDown,LegUp_5,LegUp_10,LegUp_15,LegUp_20
2008-10-10,901.0,331.0,69.0,336.0,335.0
2001-09-11,889.0,145.0,111.0,239.0,376.0
2008-01-22,844.0,328.0,360.0,302.0,344.0
2001-09-21,813.0,572.0,696.0,816.0,731.0
2002-07-24,799.0,515.0,384.0,373.0,572.0
2008-01-23,789.0,345.0,256.0,319.0,290.0
2001-09-17,769.0,116.0,339.0,405.0,522.0
2008-10-09,768.0,102.0,0.0,120.0,208.0
2001-09-12,764.0,137.0,126.0,169.0,400.0
2002-07-23,759.0,331.0,183.0,285.0,421.0
2008-10-16,758.0,102.0,222.0,310.0,201.0
2008-10-17,740.0,-48.0,219.0,218.0,116.0
2015-08-24,731.0,nan,nan,nan,nan
2002-07-22,729.0,292.0,62.0,262.0,368.0
...
...
...
2001-10-05,-364.0,228.0,143.0,286.0,230.0
1999-01-04,-370.0,219.0,99.0,-7.0,191.0
2000-03-06,-382.0,-60.0,-127.0,-39.0,-161.0
2000-02-14,-393.0,-92.0,90.0,340.0,230.0
2000-02-09,-400.0,-22.0,-46.0,96.0,270.0
1999-01-05,-438.0,3.0,5.0,-107.0,5.0
1999-01-07,-446.0,-196.0,-6.0,-82.0,-50.0
1999-01-06,-536.0,-231.0,-42.0,-174.0,-129.0
The August 2015 leg down shows up at place 13th. Obviously a non-common ocurrence although greater have happened.
What to do out of the follow up legs that point upwards is a lot more for staticians and bright math minds than for me.
Details about the implementation (see the entire module code at the end) of the
LegUpDownAnalyzer:
-
It creates indicators in
__init__just as other objects do:Strategies,Indicatorsbeing usually the usual suspectsThese indicators get automatically registered to the strategy to which the analyzer is attached
-
Just like strategies the
Analyzerhasself.datas(an array of datas) and aliases to it:self.data,self.data0,self.data1… -
Again like strategies:
nexstartandstophooks (those are not present in indicators)In this case used to:
-
nextstart: record the initial starting point of the strategy -
stop: making the final calculations because things are done
-
-
Note: other methods like
start,prenextandnextare not needed in this case -
The
LegDownUpAnalyzermethodprinthas been overriden to no longer call thepprintmethod but to create a CSV printout of the calculations
After much talk and since we added --plot to the mix … the chart.
Finally the legupdown module which is being loaded by bt-run.
from __future__ import (absolute_import, division, print_function,
                        unicode_literals)

import itertools
import operator

import six
from six.moves import map, xrange, zip

import backtrader as bt
import backtrader.indicators as btind
from backtrader.utils import OrderedDict


class LegDown(bt.Indicator):
    '''
    Calculates what the current legdown has been using:
      - Current low
      - High from ``period`` bars ago
    '''
    lines = ('legdown',)
    params = (('period', 10),)

    def __init__(self):
        self.lines.legdown = self.data.high(-self.p.period) - self.data.low


class LegUp(bt.Indicator):
    '''
    Calculates what the current legup has been using:
      - Current high
      - Low from ``period`` bars ago

    If param ``writeback`` is True the value will be written
    backwards ``period`` bars ago
    '''
    lines = ('legup',)
    params = (('period', 10), ('writeback', True),)

    def __init__(self):
        self.lu = self.data.high - self.data.low(-self.p.period)
        self.lines.legup = self.lu(self.p.period * self.p.writeback)


class LegDownUpAnalyzer(bt.Analyzer):
    params = (
        # If created indicators have to be plotteda along the data
        ('plotind', True),
        # period to consider for a legdown
        ('ldown', 10),
        # periods for the following legups after a legdown
        ('lups', [5, 10, 15, 20]),
        # How to sort: date-asc, date-desc, legdown-asc, legdown-desc
        ('sort', 'legdown-desc'),
    )

    sort_options = ['date-asc', 'date-des', 'legdown-desc', 'legdown-asc']

    def __init__(self):
        # Create the legdown indicator
        self.ldown = LegDown(self.data, period=self.p.ldown)
        self.ldown.plotinfo.plot = self.p.plotind

        # Create the legup indicators indicator - writeback is not touched
        # so the values will be written back the selected period and therefore
        # be aligned with the end of the legdown
        self.lups = list()
        for lup in self.p.lups:
            legup = LegUp(self.data, period=lup)
            legup.plotinfo.plot = self.p.plotind
            self.lups.append(legup)

    def nextstart(self):
        self.start = len(self.data) - 1

    def stop(self):
        # Calculate start and ending points with values
        start = self.start
        end = len(self.data)
        size = end - start

        # Prepare dates (key in the returned dictionary)
        dtnumslice = self.strategy.data.datetime.getzero(start, size)
        dtslice = map(lambda x: bt.num2date(x).date(), dtnumslice)
        keys = dtslice

        # Prepare the values, a list for each key item
        # leg down
        ldown = self.ldown.legdown.getzero(start, size)
        # as many legs up as requested
        lups = [up.legup.getzero(start, size) for up in self.lups]

        # put legs down/up together and interleave (zip)
        vals = [ldown] + lups
        zvals = zip(*vals)

        # Prepare sorting options
        if self.p.sort == 'date-asc':
            reverse, item = False, 0
        elif self.p.sort == 'date-desc':
            reverse, item = True, 0
        elif self.p.sort == 'legdown-asc':
            reverse, item = False, 1
        elif self.p.sort == 'legdown-desc':
            reverse, item = True, 1
        else:
            # Default ordering - date-asc
            reverse, item = False, 0

        # Prepare a sorted array of 2-tuples
        keyvals_sorted = sorted(zip(keys, zvals),
                                reverse=reverse,
                                key=operator.itemgetter(item))

        # Use it to build an ordereddict
        self.ret = OrderedDict(keyvals_sorted)

    def get_analysis(self):
        return self.ret

    def print(self, *args, **kwargs):
        # Overriden to change default behavior (call pprint)
        # provides a CSV printout of the legs down/up
        header_items = ['Date', 'LegDown']
        header_items.extend(['LegUp_%d' % x for x in self.p.lups])
        header_txt = ','.join(header_items)
        print(header_txt)

        for key, vals in six.iteritems(self.ret):
            keytxt = key.strftime('%Y-%m-%d')
            txt = ','.join(itertools.chain([keytxt], map(str, vals)))
            print(txt)