Pyfolio Integration
Note
Feb 2017
pyfolio APIs have changed and create_full_tear_sheet no longer
has a gross_lev as a named argument.
Consequently the sample below doesn’t work
A first look at the tutorial deemed it as difficult, given the tight integration amongst zipline and pyfolio, but the sample test data available with pyfolio for some other uses is actually pretty useful to decode what’s running behind the scenes and hence the wonder of integration.
The integration of a portfolio tool, namely pyfolio, came up with in
Ticket #108.
Most of the pieces were already in-place in backtrader:
-
Analyzer infrastructure
-
Children analyzer
-
A TimeReturn analyzer
Only a main PyFolio analyzer and 3 easy children analyzer are
needed. Plus a method that relies on one of the dependencies already needed by
pyfolio which is pandas.
The most challenging part … “getting all the dependencies right”.
-
Update of
pandas -
Update of
numpy -
Update of
scikit-lean -
Update of
seaborn
Under Unix-like environments with a C compiler it’s all about time. Under Windows and even with the specific Microsoft compiler installed (in this case the chain for Python 2.7) things failed. But a well known site with a collection of up-to-date packages for Windows helped. Visit it if you ever need it:
The integration wouldn’t be complete if it wasn’t tested and that’s why the usual sample is as always present.
No PyFolio
The sample uses random.randint to decide when to buy/sell, so this is
simply a check that things are working:
$ ./pyfoliotest.py --printout --no-pyfolio --plot
Output:
Len,Datetime,Open,High,Low,Close,Volume,OpenInterest
0001,2005-01-03T23:59:59,38.36,38.90,37.65,38.18,25482800.00,0.00
BUY  1000 @%23.58
0002,2005-01-04T23:59:59,38.45,38.54,36.46,36.58,26625300.00,0.00
BUY  1000 @%36.58
SELL 500 @%22.47
0003,2005-01-05T23:59:59,36.69,36.98,36.06,36.13,18469100.00,0.00
...
SELL 500 @%37.51
0502,2006-12-28T23:59:59,25.62,25.72,25.30,25.36,11908400.00,0.00
0503,2006-12-29T23:59:59,25.42,25.82,25.33,25.54,16297800.00,0.00
SELL 250 @%17.14
SELL 250 @%37.01
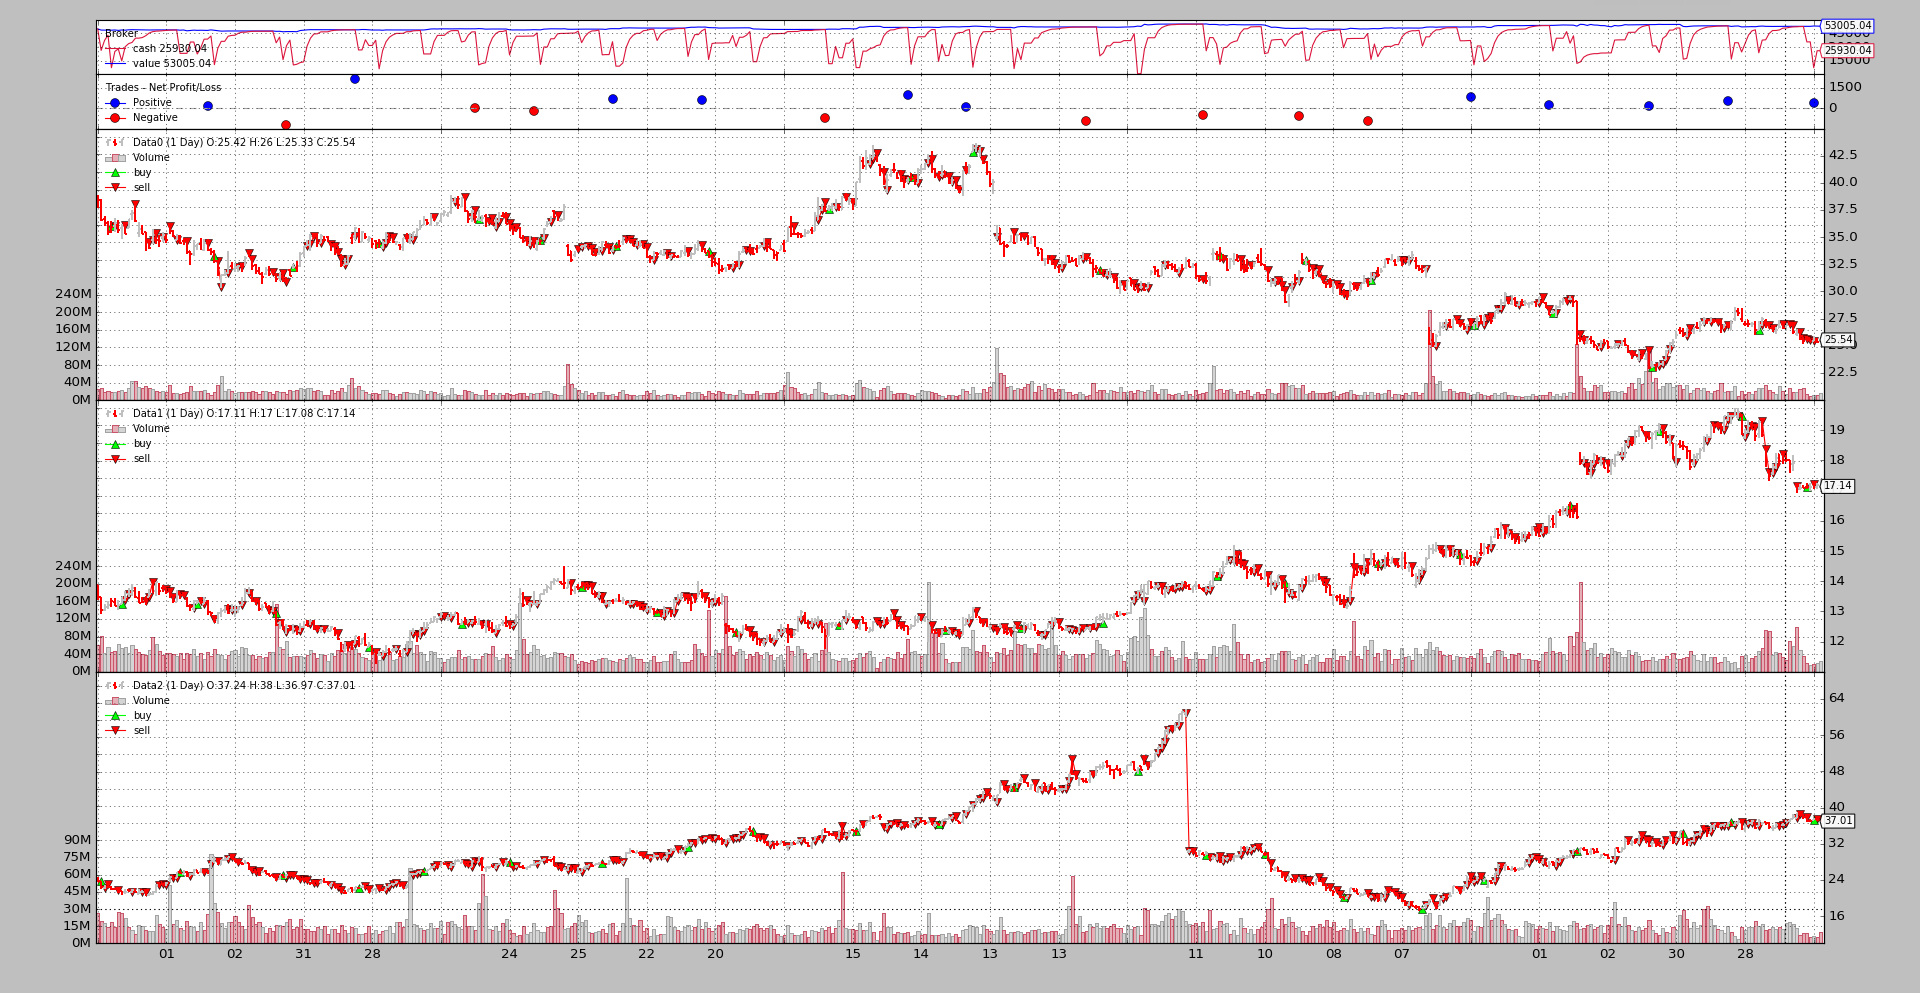
There a 3 datas and several buy and sell operations are randomly chosen and scattered over the 2 year default life of the test run
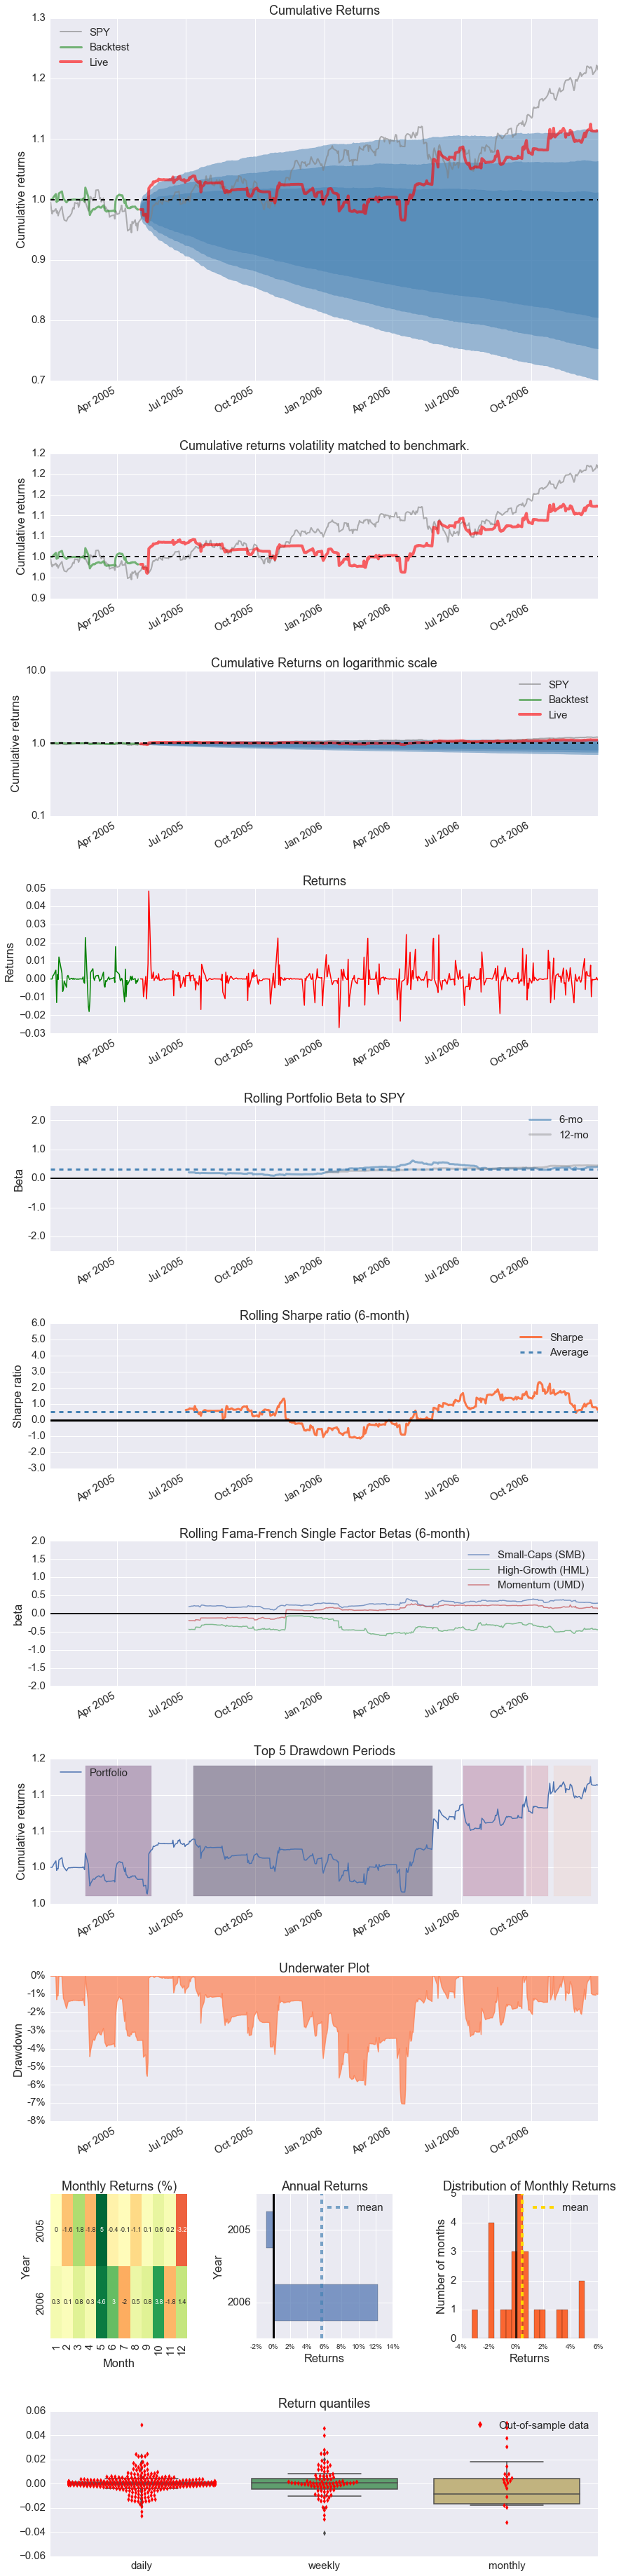
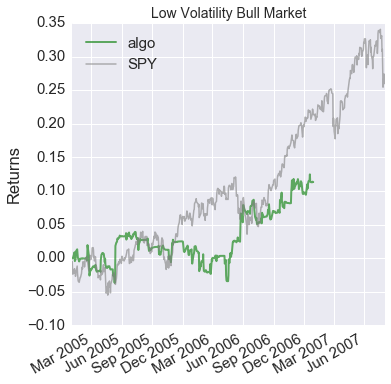
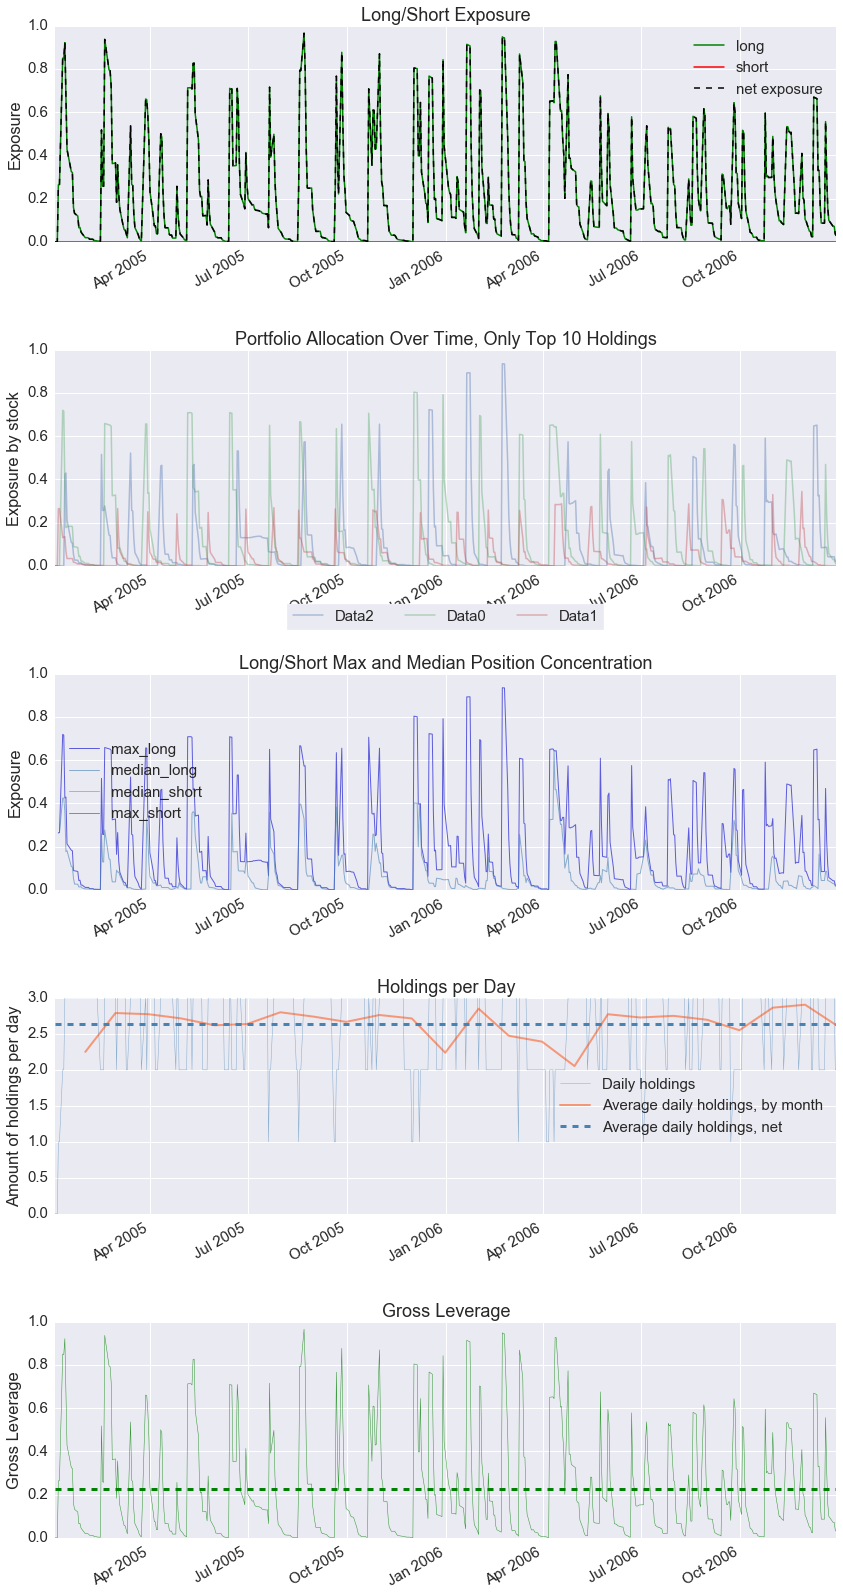
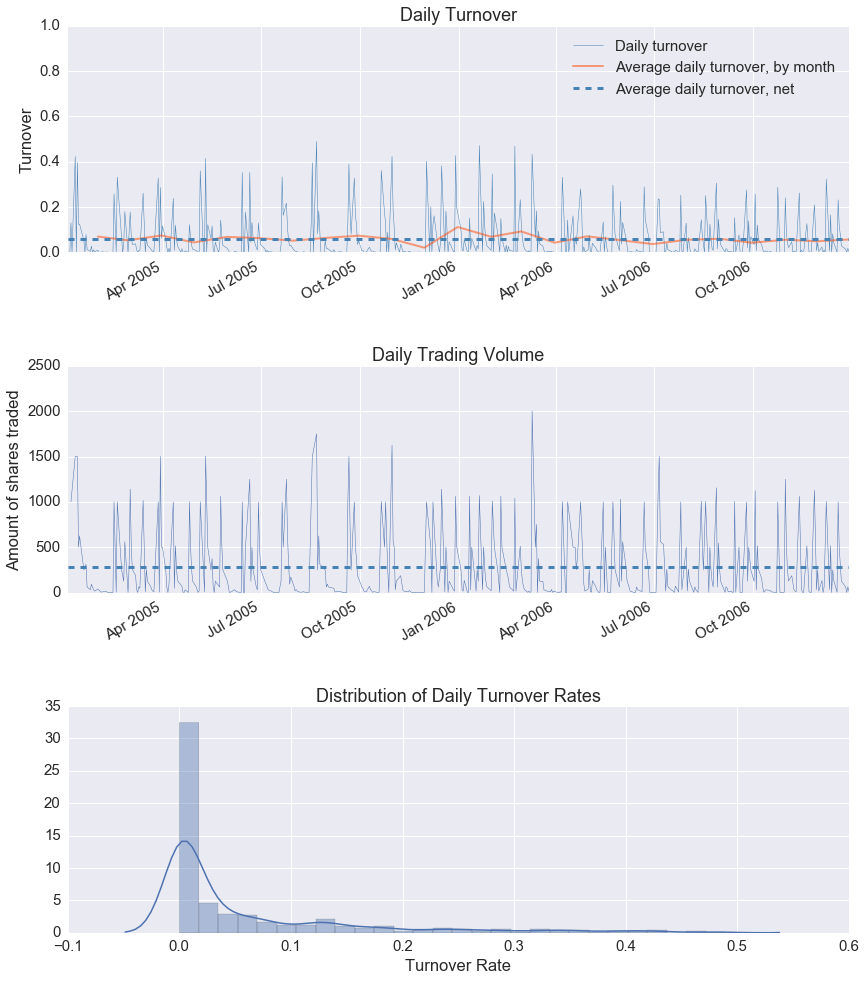
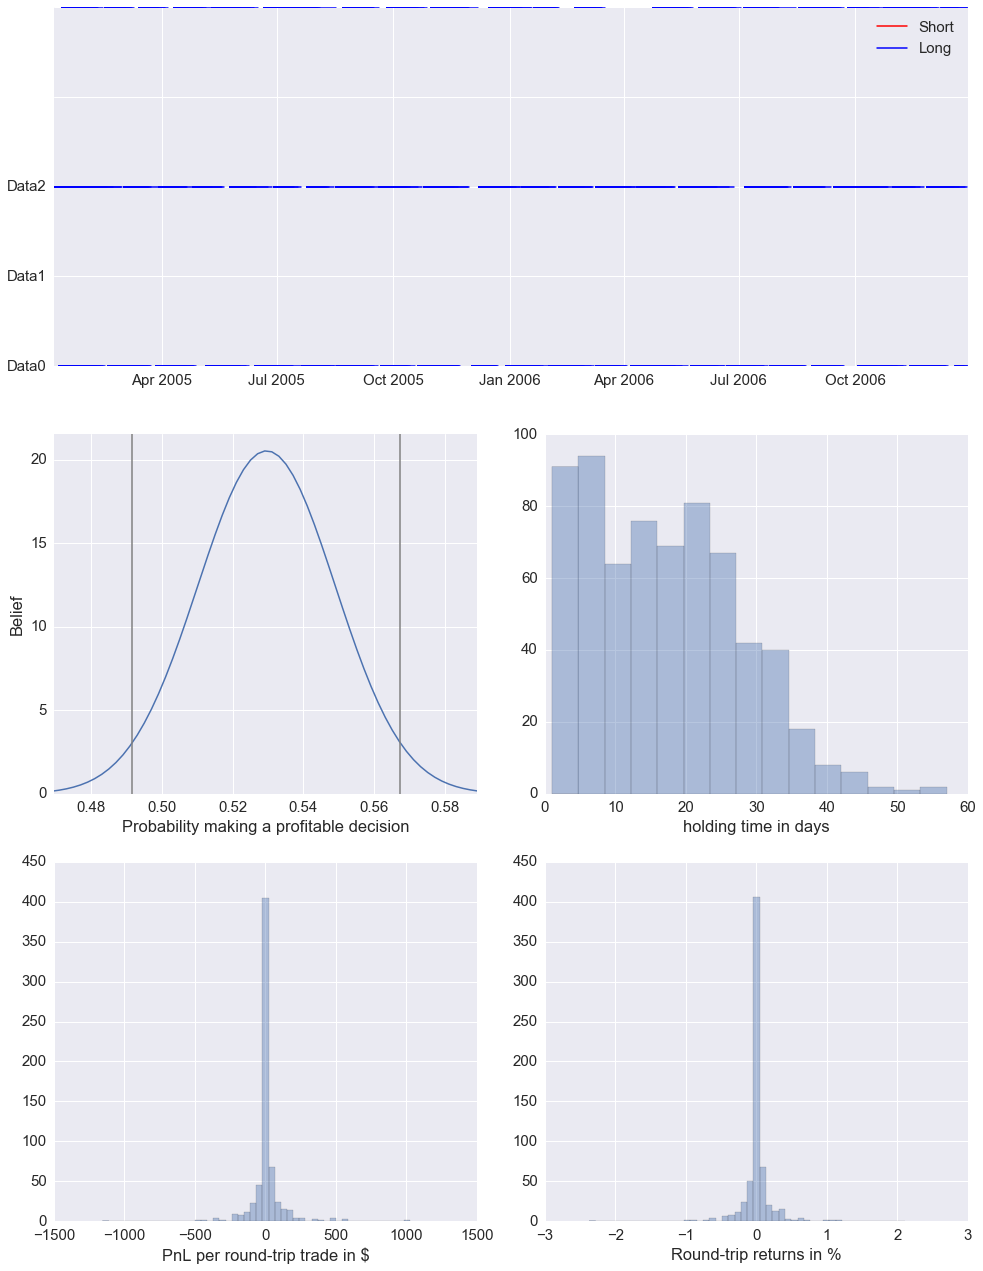
A PyFolio run
pyfolio things work well when running inside a Jupyter Notebook including
inline plotting. Here is the notebook
Note
runstrat gets here [] as argument to run with default arguments
and skip arguments passed by the notebook itself
%matplotlib inline
from __future__ import (absolute_import, division, print_function,
                        unicode_literals)


import argparse
import datetime
import random

import backtrader as bt


class St(bt.Strategy):
    params = (
        ('printout', False),
        ('stake', 1000),
    )

    def __init__(self):
        pass

    def start(self):
        if self.p.printout:
            txtfields = list()
            txtfields.append('Len')
            txtfields.append('Datetime')
            txtfields.append('Open')
            txtfields.append('High')
            txtfields.append('Low')
            txtfields.append('Close')
            txtfields.append('Volume')
            txtfields.append('OpenInterest')
            print(','.join(txtfields))

    def next(self):
        if self.p.printout:
            # Print only 1st data ... is just a check that things are running
            txtfields = list()
            txtfields.append('%04d' % len(self))
            txtfields.append(self.data.datetime.datetime(0).isoformat())
            txtfields.append('%.2f' % self.data0.open[0])
            txtfields.append('%.2f' % self.data0.high[0])
            txtfields.append('%.2f' % self.data0.low[0])
            txtfields.append('%.2f' % self.data0.close[0])
            txtfields.append('%.2f' % self.data0.volume[0])
            txtfields.append('%.2f' % self.data0.openinterest[0])
            print(','.join(txtfields))

        # Data 0
        for data in self.datas:
            toss = random.randint(1, 10)
            curpos = self.getposition(data)
            if curpos.size:
                if toss > 5:
                    size = curpos.size // 2
                    self.sell(data=data, size=size)
                    if self.p.printout:
                        print('SELL {} @%{}'.format(size, data.close[0]))

            elif toss < 5:
                self.buy(data=data, size=self.p.stake)
                if self.p.printout:
                    print('BUY  {} @%{}'.format(self.p.stake, data.close[0]))


def runstrat(args=None):
    args = parse_args(args)

    cerebro = bt.Cerebro()
    cerebro.broker.set_cash(args.cash)

    dkwargs = dict()
    if args.fromdate:
        fromdate = datetime.datetime.strptime(args.fromdate, '%Y-%m-%d')
        dkwargs['fromdate'] = fromdate

    if args.todate:
        todate = datetime.datetime.strptime(args.todate, '%Y-%m-%d')
        dkwargs['todate'] = todate

    data0 = bt.feeds.BacktraderCSVData(dataname=args.data0, **dkwargs)
    cerebro.adddata(data0, name='Data0')

    data1 = bt.feeds.BacktraderCSVData(dataname=args.data1, **dkwargs)
    cerebro.adddata(data1, name='Data1')

    data2 = bt.feeds.BacktraderCSVData(dataname=args.data2, **dkwargs)
    cerebro.adddata(data2, name='Data2')

    cerebro.addstrategy(St, printout=args.printout)
    if not args.no_pyfolio:
        cerebro.addanalyzer(bt.analyzers.PyFolio, _name='pyfolio')

    results = cerebro.run()
    if not args.no_pyfolio:
        strat = results[0]
        pyfoliozer = strat.analyzers.getbyname('pyfolio')

        returns, positions, transactions, gross_lev = pyfoliozer.get_pf_items()
        if args.printout:
            print('-- RETURNS')
            print(returns)
            print('-- POSITIONS')
            print(positions)
            print('-- TRANSACTIONS')
            print(transactions)
            print('-- GROSS LEVERAGE')
            print(gross_lev)

        import pyfolio as pf
        pf.create_full_tear_sheet(
            returns,
            positions=positions,
            transactions=transactions,
            gross_lev=gross_lev,
            live_start_date='2005-05-01',
            round_trips=True)

    if args.plot:
        cerebro.plot(style=args.plot_style)


def parse_args(args=None):

    parser = argparse.ArgumentParser(
        formatter_class=argparse.ArgumentDefaultsHelpFormatter,
        description='Sample for pivot point and cross plotting')

    parser.add_argument('--data0', required=False,
                        default='../../datas/yhoo-1996-2015.txt',
                        help='Data to be read in')

    parser.add_argument('--data1', required=False,
                        default='../../datas/orcl-1995-2014.txt',
                        help='Data to be read in')

    parser.add_argument('--data2', required=False,
                        default='../../datas/nvda-1999-2014.txt',
                        help='Data to be read in')

    parser.add_argument('--fromdate', required=False,
                        default='2005-01-01',
                        help='Starting date in YYYY-MM-DD format')

    parser.add_argument('--todate', required=False,
                        default='2006-12-31',
                        help='Ending date in YYYY-MM-DD format')

    parser.add_argument('--printout', required=False, action='store_true',
                        help=('Print data lines'))

    parser.add_argument('--cash', required=False, action='store',
                        type=float, default=50000,
                        help=('Cash to start with'))

    parser.add_argument('--plot', required=False, action='store_true',
                        help=('Plot the result'))

    parser.add_argument('--plot-style', required=False, action='store',
                        default='bar', choices=['bar', 'candle', 'line'],
                        help=('Plot style'))

    parser.add_argument('--no-pyfolio', required=False, action='store_true',
                        help=('Do not do pyfolio things'))

    import sys
    aargs = args if args is not None else sys.argv[1:]
    return parser.parse_args(aargs)
runstrat([])
Entire data start date: 2005-01-03
Entire data end date: 2006-12-29


Out-of-Sample Months: 20
Backtest Months: 3
[-0.012 -0.025]
D:drobinWinPython-64bit-2.7.10.3python-2.7.10.amd64libsite-packagespyfolioplotting.py:1210: FutureWarning: .resample() is now a deferred operation
use .resample(...).mean() instead of .resample(...)
  **kwargs)
<matplotlib.figure.Figure at 0x23982b70>
Usage of the sample:
$ ./pyfoliotest.py --help
usage: pyfoliotest.py [-h] [--data0 DATA0] [--data1 DATA1] [--data2 DATA2]
                      [--fromdate FROMDATE] [--todate TODATE] [--printout]
                      [--cash CASH] [--plot] [--plot-style {bar,candle,line}]
                      [--no-pyfolio]

Sample for pivot point and cross plotting

optional arguments:
  -h, --help            show this help message and exit
  --data0 DATA0         Data to be read in (default:
                        ../../datas/yhoo-1996-2015.txt)
  --data1 DATA1         Data to be read in (default:
                        ../../datas/orcl-1995-2014.txt)
  --data2 DATA2         Data to be read in (default:
                        ../../datas/nvda-1999-2014.txt)
  --fromdate FROMDATE   Starting date in YYYY-MM-DD format (default:
                        2005-01-01)
  --todate TODATE       Ending date in YYYY-MM-DD format (default: 2006-12-31)
  --printout            Print data lines (default: False)
  --cash CASH           Cash to start with (default: 50000)
  --plot                Plot the result (default: False)
  --plot-style {bar,candle,line}
                        Plot style (default: bar)
  --no-pyfolio          Do not do pyfolio things (default: False)