Developing an Indicator
After much ado in fine tuning backtrader (give it had already been running for a while) I decided to not only share it via GitHub but to also tell the world it was there and posted about its existence in "Reddit".
Following a comment about why trading/algorithmic trading platforms pop up and a private question about the platform supporting live trading for many simultenaous tickers I came to the conclusion that my own child deserved its own blog.
And here we are. But let’s focus on business.
backtrader is meant to let me experiment quickly with ideas and check what
my eyes may have told me it may be a chance.
backtrader (right now) is all about backtesting and has not been connected
to any live trading platform and may not even be (although I do believe the
technical implementation would allow for it)
When I use the expression "experimenting with ideas" I mean two things:
-
Being able to quickly draft an indicator and be able to visually evaluate its behavior
-
Be it the case, engage in developing potential strategy around that indicator or a combination with others
My personal trading is 100% judgemental in that no single decision is taken by an automated system. But I look at what indicators have to tell. Whether the "indications" are really a signal or not, it’s left to my faulty human mind.
But let’s experiment. Right after publishing for the 1st time to Reddit I added a well known indicator:
- Trix
Stockcharts has a nice discussion on Trix at: ChartSchool - Trix
Let’s experiment how to do it, with the minimum possible of lines:
from __future__ import (absolute_import, division, print_function,
                        unicode_literals)

import backtrader as bt
import backtrader.indicators as btind


class MyTrix(bt.Indicator):

    lines = ('trix',)
    params = (('period', 15),)

    def __init__(self):
        ema1 = btind.EMA(self.data, period=self.p.period)
        ema2 = btind.EMA(ema1, period=self.p.period)
        ema3 = btind.EMA(ema2, period=self.p.period)

        self.lines.trix = 100.0 * (ema3 - ema3(-1)) / ema3(-1)
And the Trix indicator is up and running. Looking at this and as the author of the platform I do truly believe my goal of being able to quickly experiment with new ideas with ease of use … has been reached.
A breakdown of the development:
-
lines = (‘trix’,)
This tuple defines the output lines (just one in this case) of the indicator. This statement at the beginning of the class declaration generates a lot of background action during class creation and object instantiation.
Suffice to say that the object has an attribute "lines" which hold the "trix".
As a bonus and if the name "trix" is not used inside the indicator itself, the "line" could also be reached with "self.trix". But for clarity I do prefer "self.lines.trix"
Additional access methods:
-
self.l.trix
-
self.lines[0] … being the index is the one corresponding to the position in the tuple
-
-
params = ((‘period’, 15),)
This tuple of tuples (can also be a dict or OrderedDict) defines the parameters the indicator accepted and declares the default values.
The burden of parsing kwargs is taken off the shoulders of the users.
Parameters can be accessed with the "self.params.xxxxx" notation or with the shorthand "self.p.xxxxx"
-
The calculation (where EMA stands for ExponentialMovingAverage)
-
ema1 = btind.EMA(self.data, period=self.p.period)
A new bonus is shown … "self.data". This seems to come out of the blue but this is again pre-processing done in the background for the indicator.
Any "data" passed to the indicator for calculation is intercepted and placed in a
self.datasarray, where the usualself.datas[0]could be used to reach the first data.Shorthands do exist and look like: self.data and self.data0 for the first data in the array. From then onwards self.data1, self.data2.
Trix only needs one data
-
ema2 = btind.EMA(ema1, period=self.p.period)
Not much to say. EMA uses ema1 as input data
-
ema3 = btind.EMA(ema2, period=self.p.period)
Even less to say
-
self.lines.trix = 100.0 * (ema3 - ema3(-1)) / ema3(-1)
First and foremost a simple 1-period percentage difference calculation is done.
The magic ema3(-1) is a notation to indicate: the previous value of ema.
And the result of the calculation is assigned to the output "line" "trix" defined during class creation.
-
Easy Peasy. But "experimenting" would not be done if I didn’t get visual feedback of what Trix is doing (even if Stockcharts has a nice essay on it).
Note
The actual Trix implemenation has some additionals bells and whistles mostly itended to beautify plotting which are of no relevance for this post.
We assume we have put the MyTrix indicator in a mytrix.py file.
from __future__ import (absolute_import, division, print_function,
                        unicode_literals)

import backtrader as bt
import backtrader.feeds as btfeeds

from mytrix import MyTrix


class NoStrategy(bt.Strategy):
    params = (('trixperiod', 15),)

    def __init__(self):
        MyTrix(self.data, period=self.p.trixperiod)


if __name__ == '__main__':
    # Create a cerebro entity
    cerebro = bt.Cerebro()

    # Add a strategy
    cerebro.addstrategy(NoStrategy, trixperiod=15)

    # Create a Data Feed
    datapath = ('../datas/2006-day-001.txt')
    data = bt.feeds.BacktraderCSVData(dataname=datapath)

    # Add the Data Feed to Cerebro
    cerebro.adddata(data)

    # Run over everything
    cerebro.run()

    # Plot the result
    cerebro.plot()
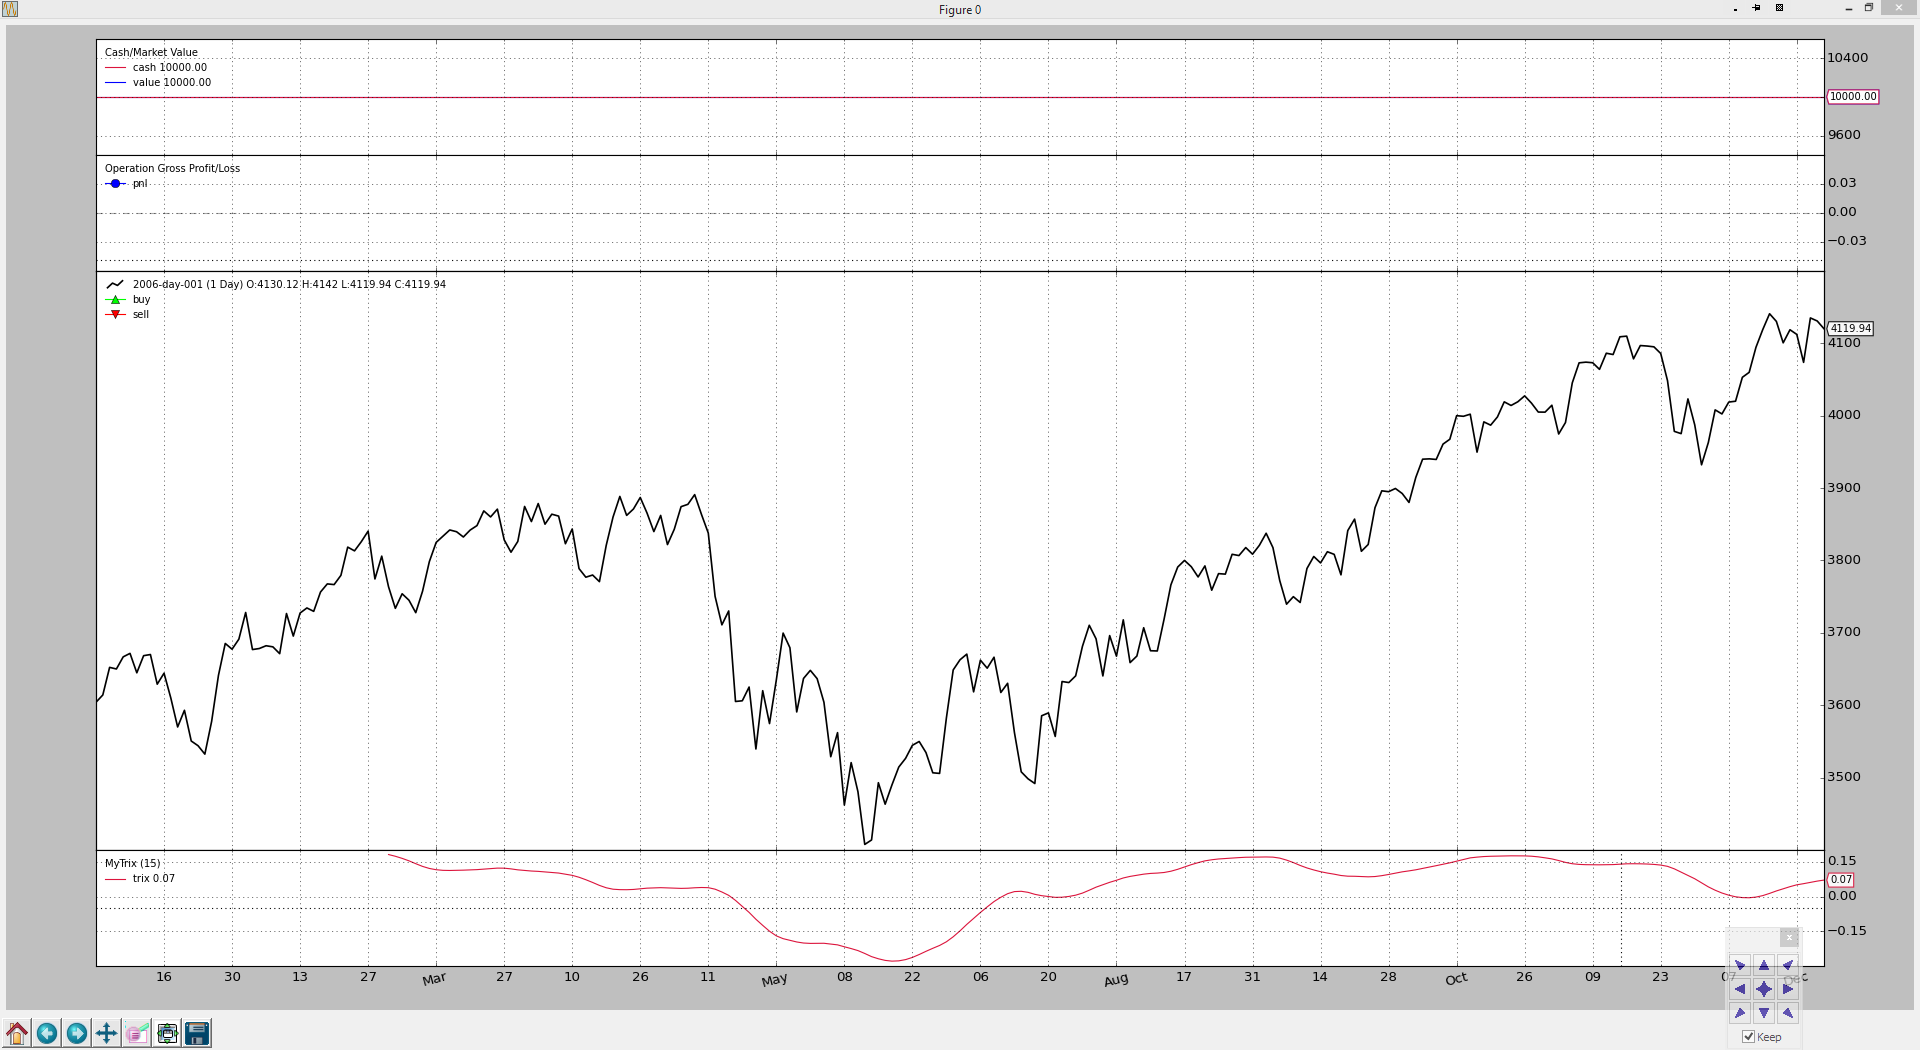
And the visual output is below (open the chart in a new window/tab for a full
size image), hopefully showing how quickly and easy an indicator can be created
and visually evaluated with backtrader