The DJI 10 day streak
It has hit the news. The DJI is hitting all time highs with already 10 consecutive updays and 9 all time highs. See for example:
Many had already, for sure, noticed that the Dow was on such a streak and the article just tells us it’s becoming mainstream. But some questions arise:
-
Is this normal or extraordinary?
-
What happens afterwards?
Let’s put backtrader in motion to answer the questions by crafting an Analyzer to do that: analyze the situation and answer the questions (See below for the code)
Our sample data contains 5923 trading sessions. Let’s see where the current
streak fits in.
Is this normal or extraordinary?
Executing our code shows that 10 such days in a row is something at least
remarkable if not extraordinary.:
$ ./updaystreaks.py --data 099I-DJI --upstreak hilo=True
            count  rank  upstreak       upleg   upleg %  drawdown  rel drawdown
1987-01-02      1     1        13  219.069946  0.116193  0.017616      0.171407
2017-02-09      2     2        12  822.109375  0.041074  0.001875      0.047548
1970-11-19      3     2        12   66.900024  0.088986  0.010321      0.127055
1929-06-20      4     2        12   32.000000  0.101716  0.031134      0.340625
1991-12-18      5     3        11  315.100098  0.109167  0.011113      0.113614
1955-01-18      6     3        11   22.200012  0.057290  0.014334      0.265765
2017-07-25      7     4        10  622.289062  0.028949       NaN           NaN
2013-03-01      8     4        10  488.959961  0.034801  0.008102      0.240919
1996-11-04      9     4        10  348.839844  0.058148  0.004792      0.087605
1973-07-16     10     4        10   53.600037  0.060695  0.095935      1.686565
1959-11-17     11     4        10   31.599976  0.049945  0.011216      0.237342
1959-06-24     12     4        10   36.200012  0.057680  0.020649      0.381215
1955-08-23     13     4        10   25.400024  0.056344  0.008772      0.165353
1933-03-03     14     4        10   12.600002  0.250497  0.142415      0.730158
1920-12-29     15     4        10    8.099998  0.119118  0.022339      0.209876
2016-07-08     16     5         9  778.378906  0.043688  0.016552      0.396003
1996-05-08     17     5         9  334.369629  0.061755  0.002442      0.041990
1989-07-03     18     5         9  141.890137  0.058804  0.007179      0.129677
1968-04-23     19     5         9   38.000000  0.043123  0.070535      1.736842
1967-04-13     20     5         9   49.700012  0.059061  0.006593      0.118713
1967-01-03     21     5         9   55.799988  0.071603  0.006321      0.094982
1965-01-22     22     5         9   18.500000  0.020838  0.031326      1.540541
1964-03-06     23     5         9   19.600037  0.024506  0.016127      0.678570
1955-06-15     24     5         9   12.399994  0.028343  0.005537      0.201613
1955-04-05     25     5         9   16.299988  0.039553  0.010465      0.276074
1954-09-01     26     5         9   18.599976  0.055822  0.009325      0.177419
1945-04-06     27     5         9    9.000000  0.058140  0.008526      0.155555
1929-02-18     28     5         9   21.800018  0.072812  0.086005      1.279815
1921-10-18     29     5         9    4.300003  0.061871  0.008130      0.139536
The current streak, yet to come to an end, is ranked (tied) in 4th position. To notice:
-
The upleg in % is the smallest when the streak is 10 days or longer
-
Three (3) of the days with a streak of 9 updays are slightly smaller in % terms, dating back to 1955, 1964 and 1965
-
This year has another long streak ranked as number 2 with 12 days
What happens afterwards?
Even if the table already shows the drawdown after the streak ended and the relative drawdown (taken from the start of the streak, hence it can be > 100%), the question is better answered visually.
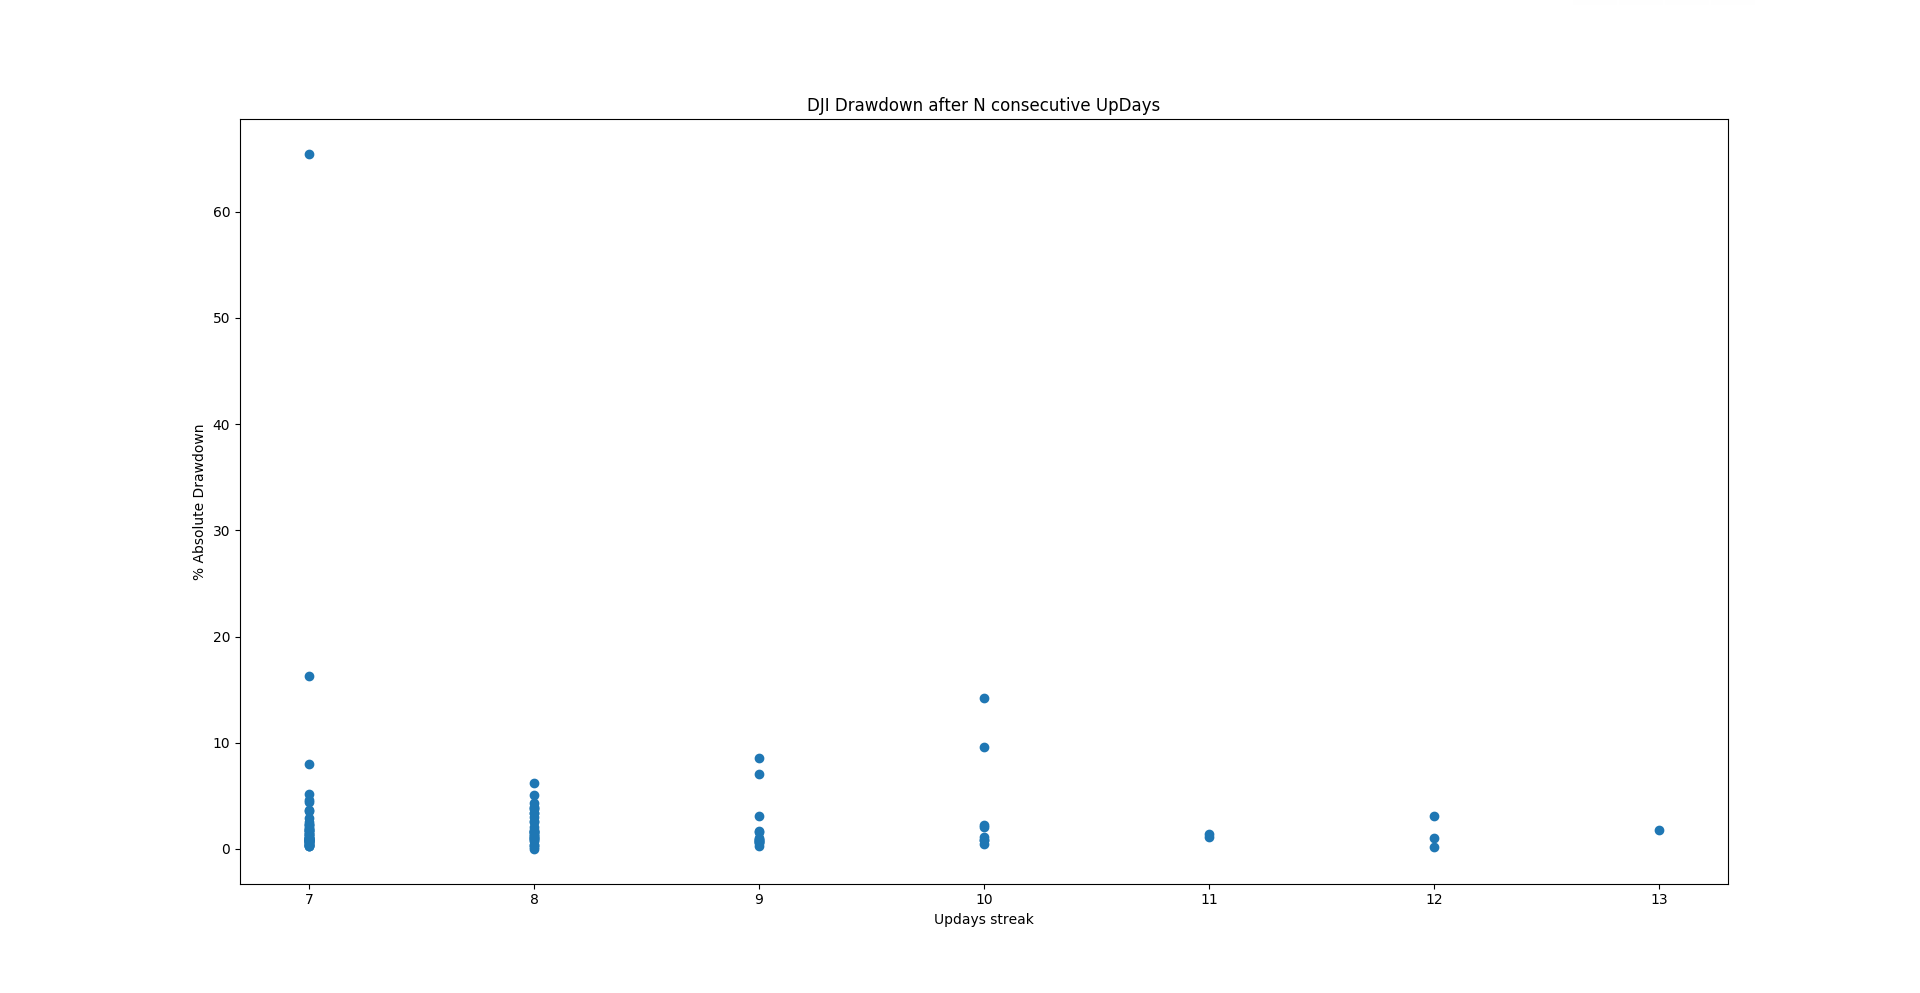
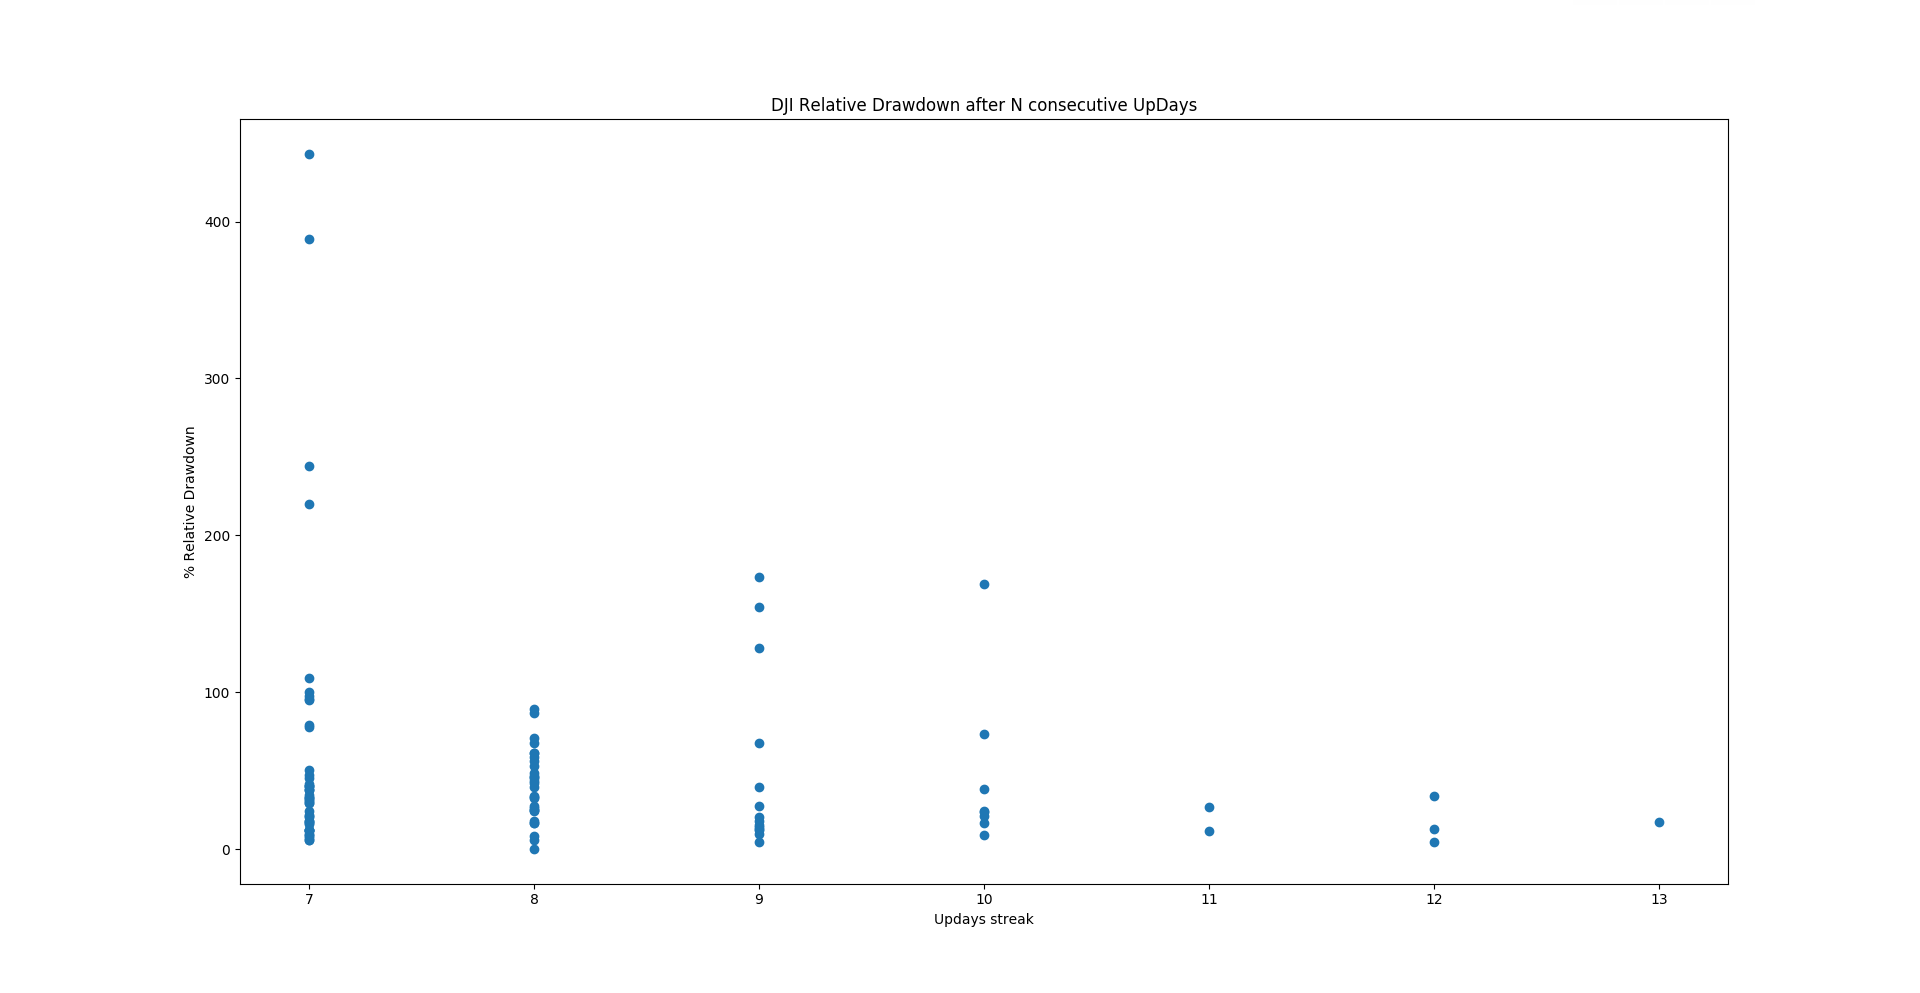
And the charts quickly show that:
- Such long streaks seem to indicate strength with no large drawdowns really to be expected as the reaction
But wait!!!
Ranked as number 1 and also ranked as number 2 we have remarkable dates:
            count  rank  upstreak       upleg   upleg %  drawdown  rel drawdown
1987-01-02      1     1        13  219.069946  0.116193  0.017616      0.171407
2017-02-09      2     2        12  822.109375  0.041074  0.001875      0.047548
1970-11-19      3     2        12   66.900024  0.088986  0.010321      0.127055
1929-06-20      4     2        12   32.000000  0.101716  0.031134      0.340625
...
Indeed, because 1987 and 1929 had later really large bear legs. But not
immediately after the streak as shown by the statistics: the relative drawdown
didn’t go over 100%, hence new highs followed the end of those streaks.
The code
from __future__ import (absolute_import, division, print_function,
                        unicode_literals)

import argparse
import collections
import datetime
import itertools

import matplotlib.pyplot as plt
import pandas as pd

import backtrader as bt


class UpStreak(bt.Analyzer):
    params = dict(
        sep=',',
        hilo=False,
    )

    def __init__(self):
        self.upday = bt.ind.UpDayBool()
        self.curdt = None  # streak start date

        self.incs = dict()  # upleg in points
        self.pincs = dict()  # upleg in percentage
        self.close0 = dict()  # starting price for upleg
        self.peaks = collections.deque()  # endng price for upleg
        self.ddown = dict()  # absolute drawdowns
        self.ddownrel = dict()  # relative drawdown (% of upleg retraced)

        self.rets = collections.defaultdict(int)  # holds main results

    def next(self):
        curclose = self.data.close[0]
        lastclose = self.data.close[-1]

        self.peaks.append((None, None))
        while True:
            dt, peak = self.peaks.popleft()
            if dt is None:
                break  # all elements seen

            if peak > curclose:  # peak not overdone, update drawdown
                ddown = 1.0 - curclose / peak
                self.ddown[dt] = max(self.ddown[dt], ddown)
                self.peaks.append((dt, peak))  # not done yet

                inc = self.incs[dt]
                fall = peak - curclose
                ddownrel = fall / inc
                self.ddownrel[dt] = max(self.ddownrel[dt], ddownrel)

        if self.upday:
            if self.curdt is None:  # streak begins
                self.curdt = self.strategy.datetime.date()
                if self.p.hilo:
                    lastclose = self.data.low[-1]
                self.close0[self.curdt] = lastclose

            self.incs[self.curdt] = inc = curclose - self.close0[self.curdt]
            self.pincs[self.curdt] = inc / self.close0[self.curdt]
            self.rets[self.curdt] += 1  # update current streak
        else:
            if self.curdt is not None:  # streak ends
                if self.p.hilo:
                    lastclose = self.data.high[-1]

                inc = self.incs[self.curdt]
                fall = lastclose - curclose
                self.ddownrel[self.curdt] = fall / inc
                self.ddown[self.curdt] = 1.0 - curclose / lastclose
                self.peaks.append((self.curdt, lastclose))

                self.curdt = None

    def stop(self):
        s = sorted(
            self.rets.items(),
            reverse=True,
            key=lambda item: (item[1], item[0])
        )
        # keep it in dict format
        self.rets = collections.OrderedDict(s)

        self.s = collections.OrderedDict(s)

        self.headers = [
            'date',
            'count', 'rank', 'upstreak',
            'upleg', 'upleg %',
            'drawdown', 'rel drawdown',
        ]

        i = 0
        count = itertools.count(1)
        last = float('inf')
        for dt, streak in self.s.items():
            if streak < last:
                i += 1
                last = streak
            ddown = self.ddown.get(dt, None)
            ddownrel = self.ddownrel.get(dt, None)
            inc = self.incs.get(dt, None)
            pinc = self.pincs.get(dt, None)

            self.s[dt] = [
                next(count), i,
                streak,
                inc, pinc,
                ddown, ddownrel
            ]

    def get_dataframe(self):
        return pd.DataFrame.from_items(
            self.s.items(),
            orient='index',
            columns=self.headers[1:],  # skip index
        )

    def print_ranking(self):
        i = 0
        last = float('inf')
        print(self.p.sep.join(self.headers))

        for dt, items in self.s.items():
            print(
                self.p.sep.join(
                    str(x) for x in itertools.chain([dt], items)
                )
            )


def runstrat(args=None):
    args = parse_args(args)

    cerebro = bt.Cerebro()

    kwargs = dict()  # Data feed kwargs

    # Parse from/to-date
    dtfmt, tmfmt = '%Y-%m-%d', 'T%H:%M:%S'
    for a, d in ((getattr(args, x), x) for x in ['fromdate', 'todate']):
        if a:
            strpfmt = dtfmt + tmfmt * ('T' in a)
            kwargs[d] = datetime.datetime.strptime(a, strpfmt)

    fromdate = kwargs.get('fromdate', datetime.date.min)

    store = bt.stores.VChartFile()
    data = store.getdata(dataname=args.data, **kwargs)
    cerebro.adddata(data)

    cerebro.addanalyzer(UpStreak, **eval('dict(' + args.upstreak + ')'))
    result = cerebro.run()
    st0 = result[0]

    a = st0.analyzers.upstreak

    # Plot some things
    # pd.set_option('display.max_columns', 500)
    pd.set_option('display.expand_frame_repr', False)
    df = a.get_dataframe()
    up = df['upstreak']

    up9 = df[up >= 9]
    print(up9)

    up7 = df[up >= 7]
    x = up7['upstreak']
    y = up7['rel drawdown'] * 100.0

    plt.scatter(x, y)
    plt.ylabel('% Relative Drawdown')
    plt.xlabel('Updays streak')
    plt.title('DJI Relative Drawdown after N consecutive UpDays')
    plt.show()

    # Plot some things
    y = up7['drawdown'] * 100.0
    plt.ylabel('% Absolute Drawdown')
    plt.xlabel('Updays streak')
    plt.title('DJI Drawdown after N consecutive UpDays')
    plt.scatter(x, y)
    plt.show()


def parse_args(pargs=None):
    parser = argparse.ArgumentParser(
        formatter_class=argparse.ArgumentDefaultsHelpFormatter,
        description=(
            'UpDayStreaks'
        )
    )

    parser.add_argument('--data', default='', required=True,
                        help='Data Ticker')

    parser.add_argument('--fromdate', required=False, default='',
                        help='Date[time] in YYYY-MM-DD[THH:MM:SS] format')

    parser.add_argument('--todate', required=False, default='',
                        help='Date[time] in YYYY-MM-DD[THH:MM:SS] format')

    parser.add_argument('--cerebro', required=False, default='',
                        metavar='kwargs', help='kwargs in key=value format')

    parser.add_argument('--upstreak', required=False, default='',
                        metavar='kwargs', help='kwargs in key=value format')

    parser.add_argument('--strat', required=False, default='',
                        metavar='kwargs', help='kwargs in key=value format')

    parser.add_argument('--plot', required=False, default='',
                        nargs='?', const='{}',
                        metavar='kwargs', help='kwargs in key=value format')

    return parser.parse_args(pargs)


if __name__ == '__main__':
    runstrat()