Beating The Random Entry
There have been recently some threads on reddit/r/algotrading about the success in replicating published algotrading strategies. First
-
Because it has been deleted here a quick summary:
-
The strategies do not work
-
If the authors claim a given strategy stopped working due to alpha decay, the tests were run against past data and it still did not work
-
Bottomline: It's all overfitting, p-hacking or a tiny alpha which doesn't need to decay because commissions do already destroy the alpha.
-
A replica to the replication problem was written by Artem Kaznatcheev in:
Followed by:
The first two were theoretical (even if the first mentioned having implemented the 130 strategies), with "Overfitting" offering actual code.
With so much going on, what about trying to replicate something which was published but not as a paper, and like in the "overfitting" case, with a practical approach. Something published in a well known book.
The target: "Trying to Beat Random Entry". This is a section in Part 3, Chapter 8 of this book:
A structured approach to engage into algotrading is presented in the book with a special emphasis on: position sizing and management of the position (i.e.: when to actually exit a trade). This being a lot more important than, for example, the entry setup, which apparently most people consider the main driver.
In Chapter 8, Van K. Tharp talks to Tom Basso and says: "From what you are saying it sounds like you could make money consistently with a random entry as long as you have good exits and size your positions intelligently.” to which the answer was that he probably could.
Rules:
- Coin-Flip based entry
- Always in the market - Long or Short
- Reentry as soon as the exit signal was given
- Volatility of the market is determined by a 10-day
Exponential Moving
    Average
of theAverage True Range - Trailing stop at distance from the close 3-times the volatility
- The stop could only move in the direction of the trade
- Fixed Stake (1 contract) or 1% risk model (Chapter 12 in the book)
Results
- Tested against 10 markets
- Fixed Stake: made money 80% of the time
- 1% Risk Model: made money 100% of the time
- Reliability level: 38% (percentage of winning trades)
The missing bits:
- Tested markets
-
Tested periods
-
If always in the market means closing the trade "today" and re-entering "tomorrow" or if it means issuing both a the closing/re-opening orders at the same time.
This is actually the easiest to overcome.
For the last two items, the book says the conversation took place in 1991 and futures were used. To be fair to the book, futures data from before 1991 will be used. 1-day price bars are also assumed, given the mention of the 10-day Exponential Moving Average
The most obvious problem seems to get the algorithm right, but in this case the book does a good job at describing the simple algorithm and the results. To complete it, let's summarize the "Percentage Risk Model" (aka "Model 3" in the book) from Chapter 12.
-
Maximal Loss: limited tox%of the account value (i.e.: the percentage risk) -
Risk per Contract: with the given algorithm, it will be the initial stop distance (3 times the volatility) multiplied by the multiplier of the future -
Amount of contracts:
Maximal Loss / Risk Per Contract
The replication details
The data
The CL (Crude Oil) futures data from 1985 to 1990 (i.e.: 6 full years) will
be used. The contract specification has a:
- Tick size:
0.01(i.e.: 100 ticks per point) - Cost per tick:
$10
With this in mind, we will use a multiplier of 1000 per 1 point (100
ticks/point x 10 dollars/tick = 1000 dollars)
Commission
A 2.00 monetary units per contract per trip will be used (IB-like)
Some implementation Details
The coin flip is modeled as an indicator, to make it easy to visualize where the flips have taken place (and if several entries, for example, go in the same direction, which is to be expected from randomness)
To also have a good visualization of the stop and how it moves, the stop price calculation and logic are also embedded in a indicator. Notice that the stop calculation logic has two different stages
-
When a trade starts the stop price has to be set at the given distance from the close with no relation to previous stop prices
-
When a trade is running, the stop price is adjusted if possible to follow the trend.
Charting
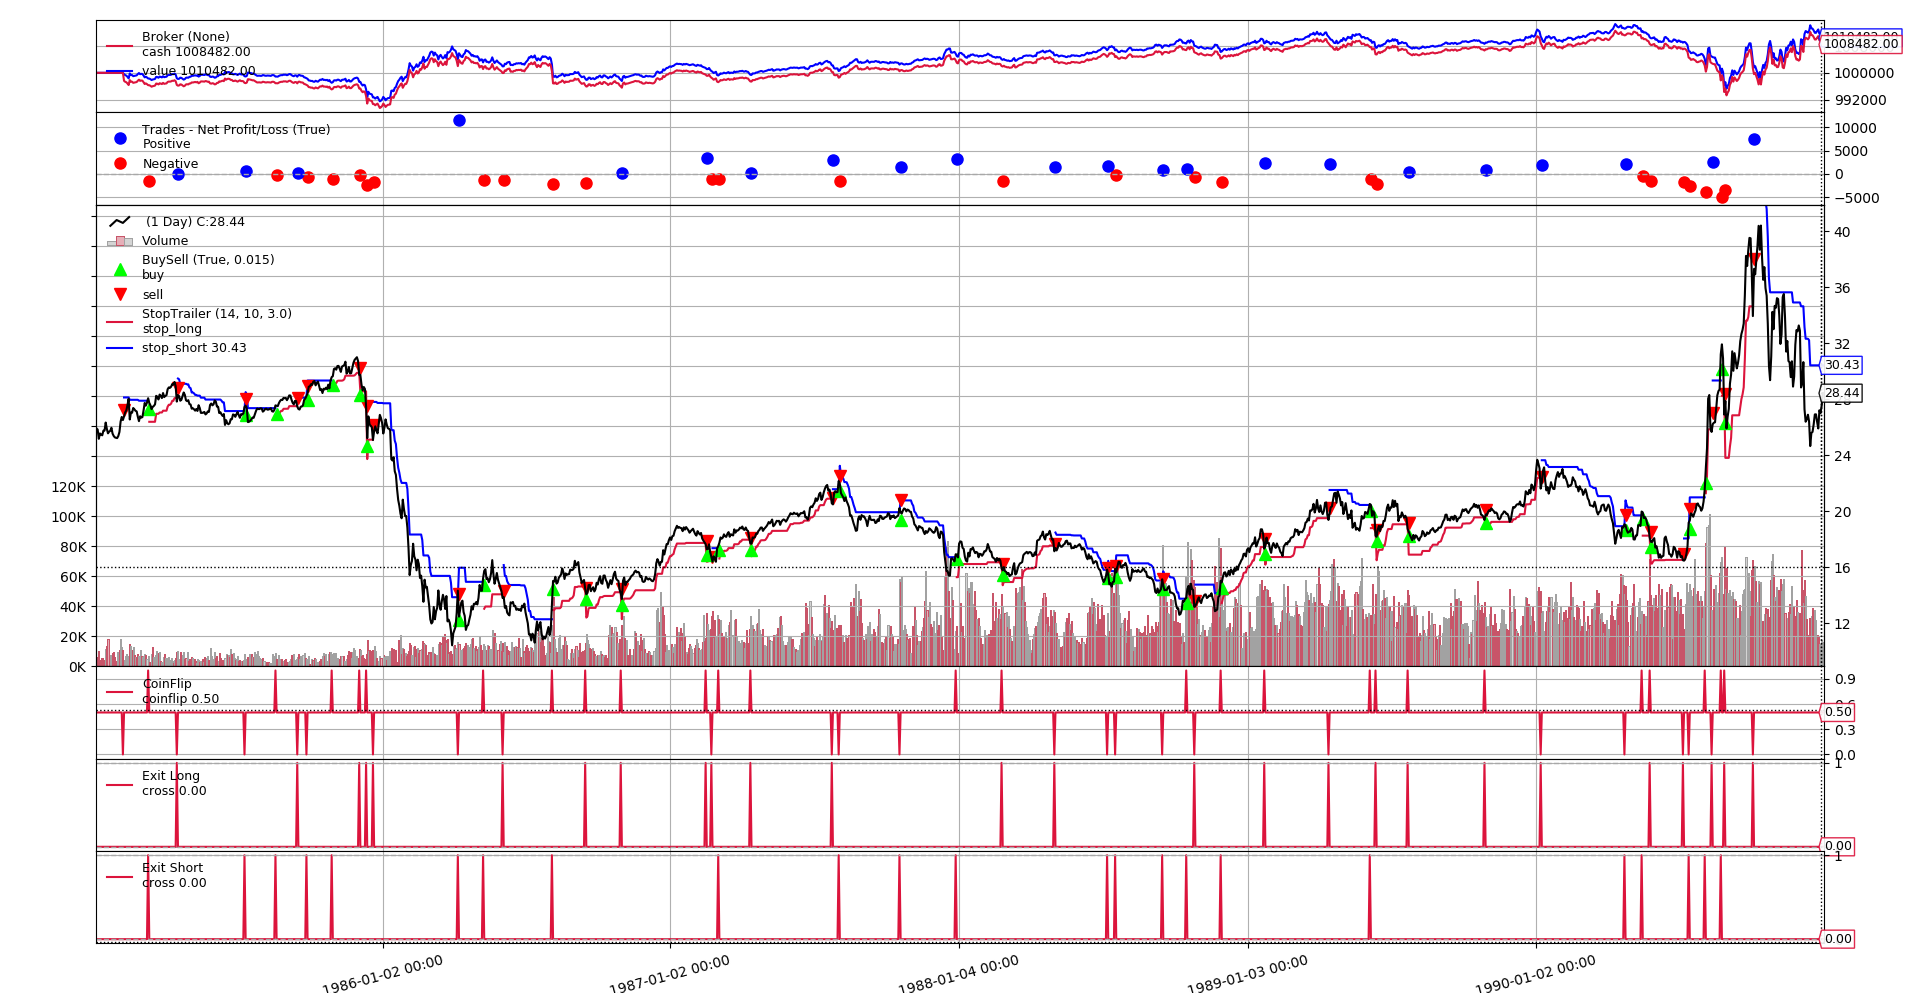
The code produces two types of charts
-
A chart containing the details a single test run (
--plot) option. It makes most sense to use it when running a single iteration (--iterations 1) -
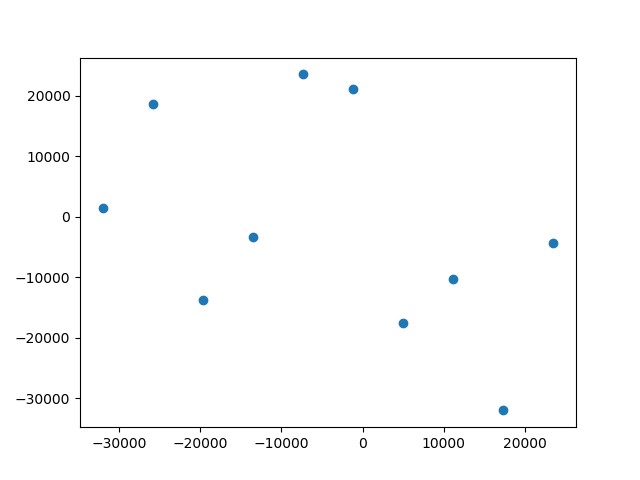
A scatter chart showing the Profit and Loss of the runs.
Sample of #1
Sample of #2 for 10 runs
Sample invocations of the script
A single run with fixed size stake of 1 and plotting
./vanktharp-coinflip.py --years 1985-1990 --fixedsize --sizer stake=1 --iterations 1 --plot

**** Iteration:    1
-- PNL: 10482.00
--   Trades 49 - Won 22 - %_Won: 0.45
**** Summary of Runs
-- Total       :        1
-- Won         :        1
-- % Won       : 1.00
**** Summary of Trades
-- Total       :       49
-- Total Won   :       22
-- % Total Won : 0.45
100 runs with a 1% risk model, 10 iterations and a scatter chart
(The output is shortened for practical purposes)
$ ./vanktharp-coinflip.py --years 1985-1990 --percrisk --sizer percrisk=0.01 --iterations 100 --scatter
**** Iteration:    1
-- PNL: -18218.00
--   Trades 60 - Won 24 - %_Won: 0.40
**** Iteration:    2
...
...
**** Iteration:  100
-- PNL: 111366.00
--   Trades 50 - Won 26 - %_Won: 0.52
**** Summary of Runs
-- Total       :      100
-- Won         :       50
-- % Won       : 0.50
**** Summary of Trades
-- Total       :     5504
-- Total Won   :     2284
-- % Total Won : 0.41
Test Runs Mix
10 test runs of 100 iterations were done, mixing the following variables:
-
Fixed size stake of 1 or percentage risk model with 1%
-
Executing entry/exit in the same bar or in consecutive bars
Summary of results
-
In average, 49% of the runs made a profit. Fixed size remained close to 50% in the test runs and the percentage risk model varied more with a test run scoring a minimum of 39% profitable runs and another scoring a maximum of 65% profitable runs (out of 10)
-
In average, 39% of the trades were profitable (small deviation)
Recalling what the book said:
-
80% of profitable runs when using a fixed size stake of 1
-
100% of profitable runs with the 1% percentage risk model
-
38% of profitable trades
It would therefore seem that:
- Only the last of the items was replicated.
Conclusion
As pointed out by Artem Kaznatcheev, the replication crisis can be due to:
-
Using the wrong data set
-
Failing to correctly implement the algorithm
Or it could well be that the original implementation did not follow its own rules or that not all details were published.
Note
In any case I do still personally recommend reading the book. Failing to replicate that specific case does not mean the book is not a good read and shows a practical approach at algotrading.
The complete script
Enjoy!
Code Also available at:
#!/usr/bin/env python
# -*- coding: utf-8; py-indent-offset:4 -*-
###############################################################################
# Copyright (C) 2019 Daniel Rodriguez - MIT License
#  - https://opensource.org/licenses/MIT
#  - https://en.wikipedia.org/wiki/MIT_License
###############################################################################
import argparse
import random

import pandas as pd

import backtrader as bt


def read_dataframe(filename, years):
    colnames = ['ticker', 'period', 'date', 'time',
                'open', 'high', 'low', 'close', 'volume', 'openinterest']

    colsused = ['date',
                'open', 'high', 'low', 'close', 'volume', 'openinterest']

    df = pd.read_csv(filename,
                     skiprows=1,  # using own column names, skip header
                     names=colnames,
                     usecols=colsused,
                     parse_dates=['date'],
                     index_col='date')

    if years:  # year or year range specified
        ysplit = years.split('-')

        # left side limit
        mask = df.index >= ((ysplit[0] or '0001') + '-01-01')  # support -YYYY

        # right side liit
        if len(ysplit) > 1:  # multiple or open ended (YYYY-ZZZZ or YYYY-)
            if ysplit[1]:  # open ended if not years[1] (YYYY- format)
                mask &= df.index <= (ysplit[1] + '-12-31')
        else:  # single year specified YYYY
            mask &= df.index <= (ysplit[0] + '-12-31')

        df = df.loc[mask]  # select the given date range

    return df


# DEFAULTS - CAN BE CHANGED VIA COMMAND LINE OPTIONS
COMMINFO_DEFAULT = dict(
    stocklike=False,  # Futures-like
    commtype=bt.CommissionInfo.COMM_FIXED,  # fixed price per asset
    commission=2.0,  # Standard IB Price for futures
    mult=1000.0,  # multiplier
    margin=2000.0,  # $50 x 50 => $2500
)


class PercentRiskSizer(bt.Sizer):
    '''Sizer modeling the Percentage Risk sizing model of Van K. Tharp'''
    params = dict(percrisk=0.01)  # 1% percentage risk

    def _getsizing(self, comminfo, cash, data, isbuy):
        # Risk per 1 contract
        risk = comminfo.p.mult * self.strategy.stoptrailer.stop_dist[0]
        # % of account value to risk
        torisk = self.broker.get_value() * self.p.percrisk
        return torisk // risk  # size to risk


class CoinFlip(bt.Indicator):
    lines = ('coinflip',)
    HEAD, TAIL = 1, 0

    def next(self):
        self.l.coinflip[0] = 0.5  # midway
        pass

    def flip(self):
        # self.l.coinflip[0] = cf = random.randrage(-1, 2, 2)  # -1 or 1
        self.l.coinflip[0] = cf = random.randint(0, 1)
        return cf

    def head(self, val=None):
        if val is None:
            return self.lines[0] == self.HEAD

        return val == self.HEAD


class StopTrailer(bt.Indicator):
    _nextforce = True  # force system into step by step calcs

    lines = ('stop_long', 'stop_short',)
    plotinfo = dict(subplot=False, plotlinelabels=True)

    params = dict(
        atrperiod=14,
        emaperiod=10,
        stopfactor=3.0,
    )

    def __init__(self):
        self.strat = self._owner  # alias for clarity

        # Volatility which determines stop distance
        atr = bt.ind.ATR(self.data, period=self.p.atrperiod)
        emaatr = bt.ind.EMA(atr, period=self.p.emaperiod)
        self.stop_dist = emaatr * self.p.stopfactor

        # Running stop price calc, applied in next according to market pos
        self.s_l = self.data - self.stop_dist
        self.s_s = self.data + self.stop_dist

    def next(self):
        # When entering the market, the stop has to be set
        if self.strat.entering > 0:  # entering long
            self.l.stop_long[0] = self.s_l[0]
        elif self.strat.entering < 0:  # entering short
            self.l.stop_short[0] = self.s_s[0]

        else:  # In the market, adjust stop only in the direction of the trade
            if self.strat.position.size > 0:
                self.l.stop_long[0] = max(self.s_l[0], self.l.stop_long[-1])
            elif self.strat.position.size < 0:
                self.l.stop_short[0] = min(self.s_s[0], self.l.stop_short[-1])


class St1(bt.Strategy):
    SHORT, NONE, LONG = -1, 0, 1

    params = dict(
        atrperiod=14,  # measure volatility over x days
        emaperiod=10,  # smooth out period for atr volatility
        stopfactor=3.0,  # actual stop distance for smoothed atr
        verbose=False,  # print out debug info
        samebar=True,  # close and re-open on samebar
    )

    def __init__(self):
        self.coinflip = CoinFlip()

        # Trailing Stop Indicator
        self.stoptrailer = st = StopTrailer(atrperiod=self.p.atrperiod,
                                            emaperiod=self.p.emaperiod,
                                            stopfactor=self.p.stopfactor)

        # Exit Criteria (Stop Trail) for long / short positions
        self.exit_long = bt.ind.CrossDown(self.data,
                                          st.stop_long, plotname='Exit Long')
        self.exit_short = bt.ind.CrossUp(self.data,
                                         st.stop_short, plotname='Exit Short')

    def start(self):
        self.entering = 0
        self.start_val = self.broker.get_value()

    def stop(self):
        self.stop_val = self.broker.get_value()
        self.pnl_val = self.stop_val - self.start_val
        self.log('Start Value: {:.2f}', self.start_val)
        self.log('Final Value: {:.2f}', self.stop_val)
        self.log('PNL   Value: {:.2f}', self.pnl_val)

    def notify_trade(self, trade):
        if trade.size > 0:
            self.log('Long  Entry at: {:.2f}', trade.price)
        elif trade.size < 0:
            self.log('Short Entry at: {:.2f}', trade.price)
        else:  # not trade.size - trade is over
            self.log('Trade PNL: {:.2f}', trade.pnlcomm)

    def next(self):
        self.logdata()

        # logic
        closing = None
        if self.position.size > 0:  # In the market - Long
            self.log('Long Stop Price: {:.2f}', self.stoptrailer.stop_long[0])
            if self.exit_long:
                closing = self.close()

        elif self.position.size < 0:  # In the market - Short
            self.log('Short Stop Price {:.2f}', self.stoptrailer.stop_short[0])
            if self.exit_short:
                closing = self.close()

        self.entering = self.NONE
        if not self.position or (closing and self.p.samebar):
            # Not in the market or closing pos and reenter in samebar
            if self.coinflip.flip():
                self.entering = self.LONG if self.buy() else self.NONE
            else:
                self.entering = self.SHORT if self.sell() else self.NONE

    def logdata(self):
        if self.p.verbose:  # logging
            txt = []
            txt += ['{:.2f}'.format(self.position.size)]
            txt += ['{:.2f}'.format(self.data.open[0])]
            txt += ['{:.2f}'.format(self.data.high[0])]
            txt += ['{:.2f}'.format(self.data.low[0])]
            txt += ['{:.2f}'.format(self.data.close[0])]
            self.log(','.join(txt))

    def log(self, txt, *args):
        if self.p.verbose:
            out = [self.datetime.date().isoformat(), txt.format(*args)]
            print(','.join(out))


def runstrat(args):
    cerebro = bt.Cerebro()

    # Data feed kwargs
    dataargs = dict(dataname=read_dataframe(args.data, args.years))
    dataargs.update(eval('dict(' + args.dargs + ')'))
    cerebro.adddata(bt.feeds.PandasData(**dataargs))

    # Strategy
    cerebro.addstrategy(St1, **eval('dict(' + args.strat + ')'))

    # Broker
    brokerargs = dict(cash=args.cash)
    brokerargs.update(eval('dict(' + args.broker + ')'))
    cerebro.broker = bt.brokers.BackBroker(**brokerargs)

    # Commission
    commargs = COMMINFO_DEFAULT
    commargs.update(eval('dict(' + args.commission + ')'))
    cerebro.broker.setcommission(**commargs)

    # Sizer
    szcls = PercentRiskSizer if args.percrisk else bt.sizers.FixedSize
    cerebro.addsizer(szcls, **(eval('dict(' + args.sizer + ')')))

    # Analyze the trades
    cerebro.addanalyzer(bt.analyzers.TradeAnalyzer, _name='trades')

    # Execute
    strats = cerebro.run(**eval('dict(' + args.cerebro + ')'))

    if args.plot:  # Plot if requested to
        cerebro.plot(**eval('dict(' + args.plot + ')'))

    return strats[0]


def run(args=None):
    args = parse_args(args)

    results = []
    sum_won_trades = 0
    sum_total_trades = 0

    for i in range(0, args.iterations):
        strat = runstrat(args)
        pnl = strat.pnl_val
        results.append(pnl)
        trades = strat.analyzers.trades.get_analysis()

        print('**** Iteration: {:4d}'.format(i + 1))
        print('-- PNL: {:.2f}'.format(pnl))
        total_trades = trades.total.closed
        total_won = trades.won.total
        perc_won = total_won / total_trades
        print('--   Trades {} - Won {} - %_Won: {:.2f}'.format(
            total_trades, total_won, perc_won))

        sum_won_trades += total_won
        sum_total_trades += total_trades

    total = len(results)
    won = sum(1 for x in results if x > 0)
    print('**** Summary of Runs')
    print('-- Total       : {:8d}'.format(total))
    print('-- Won         : {:8d}'.format(won))
    print('-- % Won       : {:.2f}'.format(won / total))

    perc_won = sum_won_trades / sum_total_trades
    print('**** Summary of Trades')
    print('-- Total       : {:8d}'.format(sum_total_trades))
    print('-- Total Won   : {:8d}'.format(sum_won_trades))
    print('-- % Total Won : {:.2f}'.format(perc_won))

    if args.scatter:
        import numpy as np
        import matplotlib.pyplot as plt
        x = np.linspace(min(results), max(results), num=len(results))
        y = np.asarray(results)
        plt.scatter(x, y)
        plt.show()


def parse_args(pargs=None):
    parser = argparse.ArgumentParser(
        formatter_class=argparse.ArgumentDefaultsHelpFormatter,
        description='Van K. Tharp/Basso Random Entry Scenario',
    )

    parser.add_argument('--iterations', default=1, type=int,
                        help='Number of iterations to run the system')

    pgroup = parser.add_argument_group(title='Data Options')
    pgroup.add_argument('--data', default='cl-day-001.txt',
                        help='Data to read in')

    pgroup.add_argument('--years', default='',
                        help='Formats: YYYY-ZZZZ / YYYY / YYYY- / -ZZZZ')

    parser.add_argument('--dargs', required=False, default='',
                        metavar='kwargs', help='kwargs in key=value format')

    pgroup = parser.add_argument_group(title='Cerebro Arguments')
    pgroup.add_argument('--cerebro', default='', metavar='kwargs',
                        help='Cerebro kwargs in key=value format')

    pgroup = parser.add_argument_group(title='Commission Arguments')
    pgroup.add_argument('--commission', default=str(COMMINFO_DEFAULT),
                        metavar='kwargs',
                        help='CommInfo kwargs in key=value format')

    pgroup = parser.add_argument_group(title='Broker Arguments')
    pgroup.add_argument('--broker', default='', metavar='kwargs',
                        help='Broker kwargs in key=value format')

    pgroup.add_argument('--cash', default=1000000.0, type=float,
                        help='Default cash')

    pgroup = parser.add_argument_group(title='Strategy Arguments')
    pgroup.add_argument('--strat', default='', metavar='kwargs',
                        help='Strategy kwargs in key=value format')

    pgroup = parser.add_argument_group(title='Sizer Options')
    pgroup.add_argument('--sizer', default='', metavar='kwargs',
                        help='Sizer kwargs in key=value format')

    pgroup = pgroup.add_mutually_exclusive_group()
    pgroup.add_argument('--percrisk', action='store_true',
                        help='Use Percrisk Sizer')

    pgroup.add_argument('--fixedsize', action='store_true',
                        help='Use Fixed Statke Sizer')

    pgroup = parser.add_argument_group(title='Plotting Options')
    pgroup.add_argument('--plot', default='', nargs='?', const='{}',
                        metavar='kwargs', help='kwargs in key=value format')

    pgroup.add_argument('--scatter', action='store_true',
                        help='Plot a scatter diagram of PNL results')

    return parser.parse_args(pargs)


if __name__ == '__main__':
    run()