Bid-Ask Data to OHLC
Lately backtrader executed an escape-from-ohlc-land by implementing line overriding, which allows to redefine the entire hierarchy and for example have data feeds which only feature bid, ask and datetime lines.
(Here to the original Escape from OHLC Land)
This opens the question as to how to visualize such data and this is most
effectively done in OHLC format (be it a bar or a candlestick)
Steps needed:
-
Define a Data Feed loader which can read the given
bid/askformat -
Decide to which fields to assign the values, ie:
open,high,lowandclose(and maybevolume -
Decide on a resampling scheme
Source data (10 rows of bid-ask data):
Date,Time,Symbol,Status,Bid,Ask,Bid Vol,Ask Vol
01/03/16,23:43:11,EUR/JPY,D,,130.520,,1000000
01/03/16,23:43:27,EUR/JPY,D,,130.520,,2000000
01/03/16,23:49:19,EUR/JPY,D,,130.510,,500000
01/03/16,23:49:22,EUR/JPY,D,,130.530,,1500000
01/03/16,23:49:25,EUR/JPY,D,,130.540,,750000
01/03/16,23:49:27,EUR/JPY,D,,130.550,,900000
01/03/16,23:51:25,EUR/JPY,D,,130.500,,1200000
01/03/16,23:52:27,EUR/JPY,D,,130.495,,1100000
01/03/16,23:53:25,EUR/JPY,D,,130.480,,600000
01/03/16,23:54:27,EUR/JPY,D,,130.470,,900000
After which:
-
Reading the data will not be a major problem, given the end result has to be OHLC and that’s what the built-in data feeds deliver after parsing. Because it is yet another variant from csv. We can even reuse the
GenericCSVDataexisting feed. Thank God it is generic -
Having only a single price element and a single volume element per line, the price assignment is clear: assign the price to the four price elements and the volume to the volume
-
When it comes down to resampling, rather than upsampling to a larger timeframe the key will be the number of bars, ie: compression
And the built-in resampler can already deliver the same timeframe but compressed
Getting the data into OHLC format with the GenericCSVData:
    data = btfeeds.GenericCSVData(
        dataname=args.data,
        dtformat='%d/%m/%y',
        # tmformat='%H%M%S',  # already the default value
        # datetime=0,  # position at default
        time=1,  # position of time
        open=5,  # position of open
        high=5,
        low=5,
        close=5,
        volume=7,
        openinterest=-1,  # -1 for not present
        timeframe=bt.TimeFrame.Ticks)
Some of the arguments don’t even need to be changed, namely:
-
tmformat: because the time in the feed already matches the default format -
datetime: because the date is in the first position in the csv stream
The others:
-
time=1: indicates that time is not in a single field withdateand which position it has -
open=5(and the same forhigh,low,close): which field in the stream will be used as source for the price -
volume=7: same as above -
openinterest=-1: a negative value indicates this field is not present
Once the data is on board it is about just resampling it:
    cerebro.resampledata(data,
                         timeframe=bt.TimeFrame.Ticks,
                         compression=args.compression)
We provide the same timeframe which the data carries TimeFrame.Ticks to
make sure that the data is not upsampled. And the compression is taken as
an argument from the command line, hence: compression=args.compression
A sample execution:
$ ./bidask-to-ohlc.py --compression 2
2016-03-01 23:43:27,130.52,130.52,130.52,130.52,3000000.0
2016-03-01 23:49:22,130.51,130.53,130.53,130.53,2000000.0
2016-03-01 23:49:27,130.54,130.55,130.55,130.55,1650000.0
2016-03-01 23:52:27,130.5,130.5,130.5,130.495,2300000.0
2016-03-01 23:54:27,130.48,130.48,130.48,130.47,1500000.0
And unsurprisingly we have gone from a Bid/Ask format to an OHLC format and
from 10 to 5 rows of data due to the 2 assigned to compression.
It should also come to no surprise that backtrader cannot make miracles and
with a compression factor which is not a divisor of the total number of
original rows it will deliver rows / compression + 1 new rows:
$ ./bidask-to-ohlc.py --compression 3
2016-03-01 23:49:19,130.52,130.52,130.52,130.51,3500000.0
2016-03-01 23:49:27,130.53,130.55,130.55,130.55,3150000.0
2016-03-01 23:53:25,130.5,130.5,130.5,130.48,2900000.0
2016-03-01 23:54:27,130.47,130.47,130.47,130.47,900000.0
In this case 10 / 3 = 3.33333 and that’s why 4 rows are delivered.
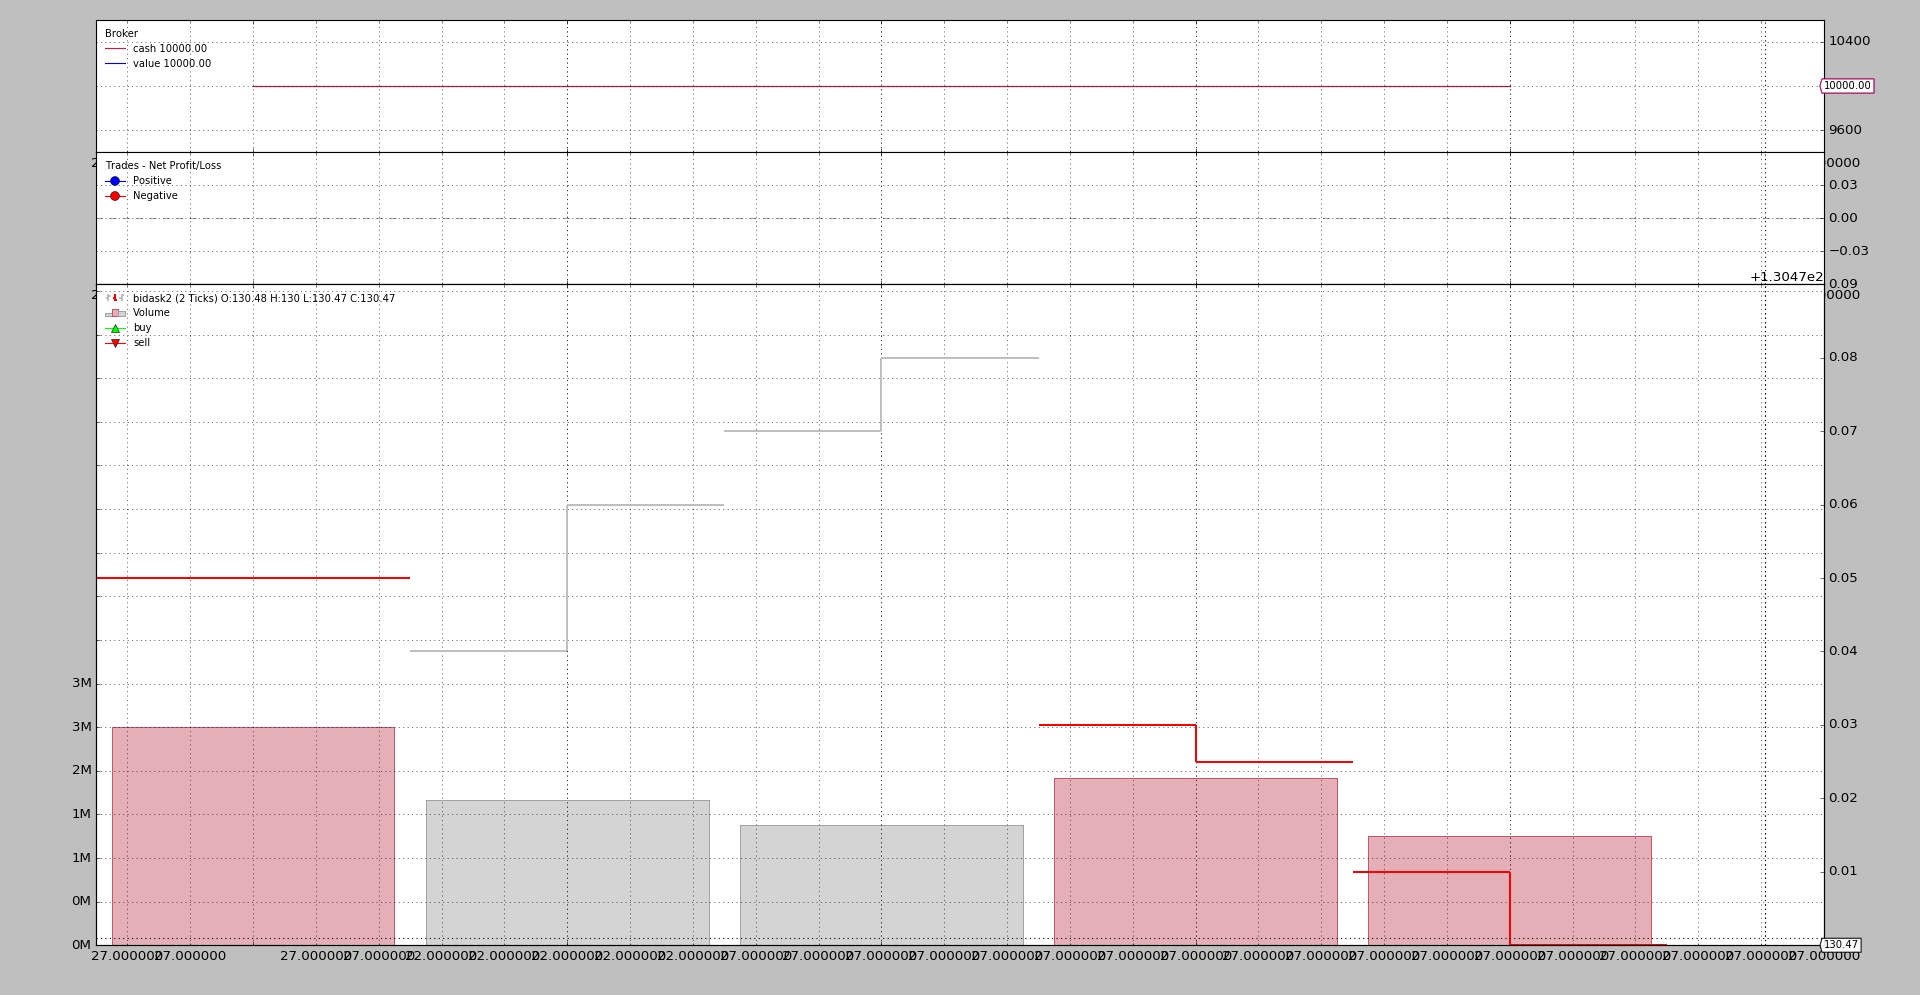
Of course now with OHLC in the hand the results can be plotted. The chart
is not really nice due to the low amount of data and the low variance of the
data and how matplotlib internally handles this situation.
The sample code (included in the sources of backtrader)
from __future__ import (absolute_import, division, print_function,)
#                        unicode_literals)

import argparse
import datetime

import backtrader as bt
import backtrader.feeds as btfeeds


class St(bt.Strategy):
    def next(self):
        print(','.join(str(x) for x in [
            self.data.datetime.datetime(),
            self.data.open[0], self.data.high[0],
            self.data.high[0], self.data.close[0],
            self.data.volume[0]]))


def runstrat():
    args = parse_args()

    cerebro = bt.Cerebro()

    data = btfeeds.GenericCSVData(
        dataname=args.data,
        dtformat='%d/%m/%y',
        # tmformat='%H%M%S',  # already the default value
        # datetime=0,  # position at default
        time=1,  # position of time
        open=5,  # position of open
        high=5,
        low=5,
        close=5,
        volume=7,
        openinterest=-1,  # -1 for not present
        timeframe=bt.TimeFrame.Ticks)

    cerebro.resampledata(data,
                         timeframe=bt.TimeFrame.Ticks,
                         compression=args.compression)

    cerebro.addstrategy(St)

    cerebro.run()
    if args.plot:
        cerebro.plot(style='bar')


def parse_args():
    parser = argparse.ArgumentParser(
        formatter_class=argparse.ArgumentDefaultsHelpFormatter,
        description='BidAsk to OHLC')

    parser.add_argument('--data', required=False,
                        default='../../datas/bidask2.csv',
                        help='Data file to be read in')

    parser.add_argument('--compression', required=False, default=2, type=int,
                        help='How much to compress the bars')

    parser.add_argument('--plot', required=False, action='store_true',
                        help='Plot the vars')

    return parser.parse_args()


if __name__ == '__main__':
    runstrat()